
Figure 2.
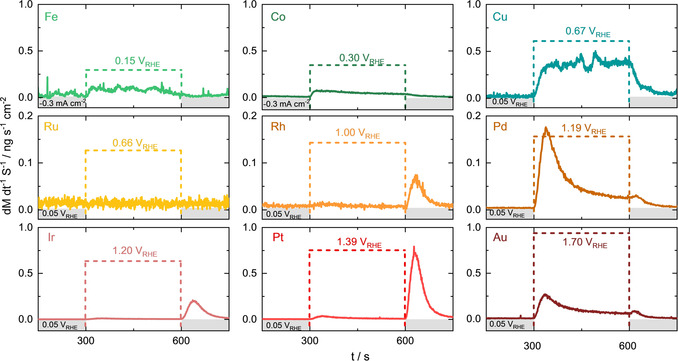
Dissolution rates in an alkaline electrolyte (0.05 M NaOH) for three metals of each transition metal d‐shell. The oxidative potential was applied as shown by the colored brackets from t=300–600 s. A reductive current or potential step was applied to all samples before and after (−0.3 mA cm−2 for Fe, Co and 0.05 VRHE for Cu, Ru, Rh, Pd, Ir, Pt, Au).