
Figure 3.
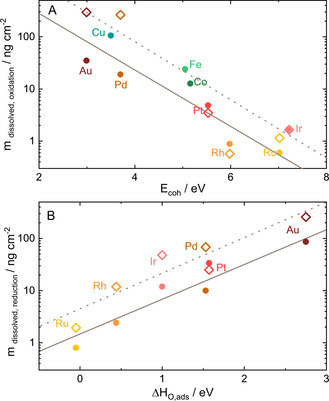
Correlation of the integrated mass of dissolved metals (alkaline, 0.05 M NaOH: solid circles; acidic, 0.1 M H2SO4: hollow squares) to their common descriptors gathered from the literature. A) Dissolution during oxidation plotted as a function of E coh and B) dissolution associated with the reduction from Figure S5, plotted as a function of ΔH O,ads. The linear fit added as a guide to the eye, visualizes the correlation in both alkaline (solid line) and acidic (dotted line) electrolytes.