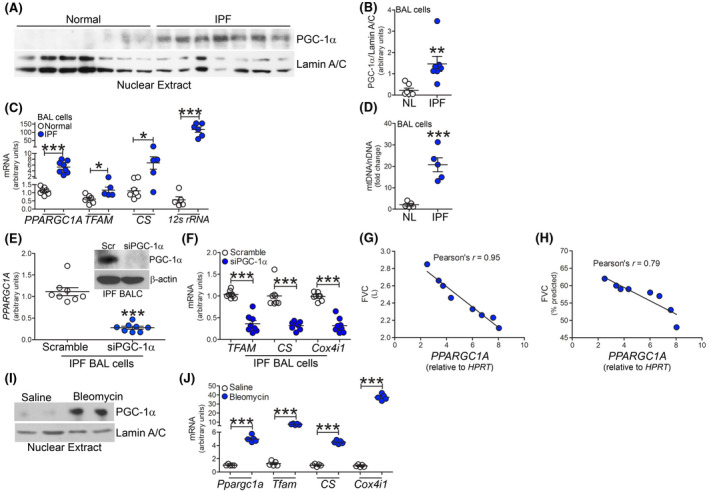
FIGURE 1.

IPF BAL cells have increased mitochondrial biogenesis. A, Nuclear immunoblot analysis and B, quantification of PGC‐1α in BAL cells from normal and IPF subjects (n = 7). mRNA expression in BAL cells from normal (n = 5‐7) or IPF subjects (n = 5‐8) for C, PPARGC1A, TFAM, CS, and 12s rRNA. D, Ratio of mtDNA to nuclear DNA in normal and IPF BAL cells (n = 5). E, mRNA analysis of PPARGC1A in IPF BALC with silencing of PGC‐1α (n = 8). Inset, PGC‐1α immunoblot analysis. F, TFAM, CS, and COX4I1 expression (n = 8) in IPF BALC with silencing of PGC‐1α. Pearson’s correlation of PPARGC1A mRNA in BAL cells and G, FVC or H, FVC % predicted in IPF subjects (n = 5). I, Nuclear immunoblot of PGC‐1α in BAL cells from saline or bleomycin‐exposed mice at 21 days. J, mRNA analysis Ppargc1a, Tfam, Cs, and Cox4i1 mRNA in BAL cells from saline or bleomycin‐exposed mice at 21 days (n = 5). *P < .05; **P < .001; ***P < .0001. Values shown as mean ± S.E.M. Two‐tailed t‐test statistical analysis was utilized for B‐F, J. Pearson’s coefficient was used for G, H
