
FIGURE 6.
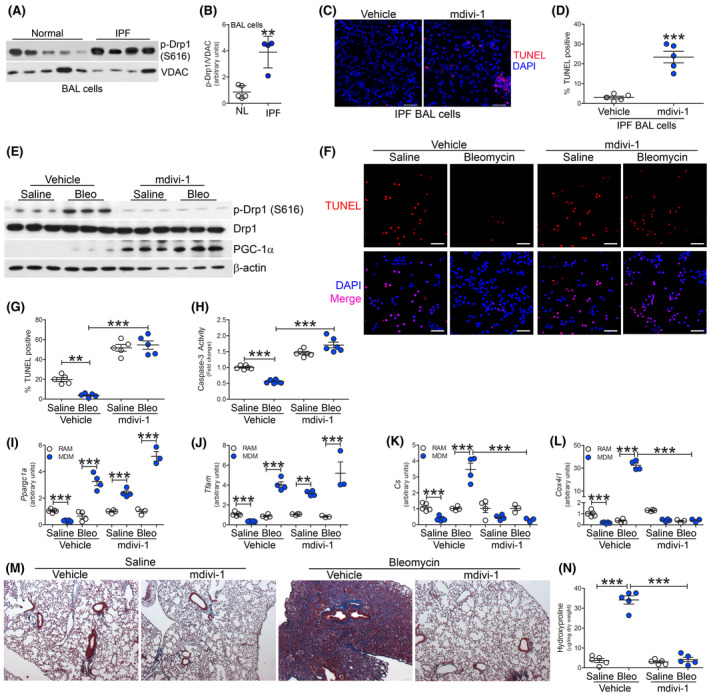
Mitochondrial division inhibitor prevents bleomycin‐induced pulmonary fibrosis. A, Immunoblot analysis and B, quantification of p‐Drp1 (S616) expression in BAL cells from normal (n = 5) or IPF subjects (n = 4). C, TUNEL staining (n = 5) and D, TUNEL quantification (n = 5) of IPF BAL cells treated with vehicle or mdivi‐1 (20 µM, overnight). Scale bar represents 50 μm. C57BL/6J WT mice were exposed to saline or bleomycin (bleo), 10 days after exposure mice were administered daily ip injections of vehicle or mdivi‐1. BAL cells were isolated 21 days later. E, Immunoblot analysis in BAL cells. F, TUNEL staining (n = 5), G, TUNEL quantification (n = 5), and H, Caspase‐3 activity (n = 6), Scale bar represent 50 μm. mRNA analysis of I, Ppargc1a (n = 5), J, Tfam (n = 5), K, Cs (n = 5), and L, Cox4i1 expression (n = 5). M, Masson’s trichrome staining of lung sections (n = 5) and N, hydroxyproline analysis (n = 5). **P < .001; ***P < .0001. Values shown as mean ± S.E.M. Two‐tailed t‐test statistical analysis was utilized for B and D. One‐way ANOVA followed by Tukey’s multiple comparison test was utilized for G‐L, N