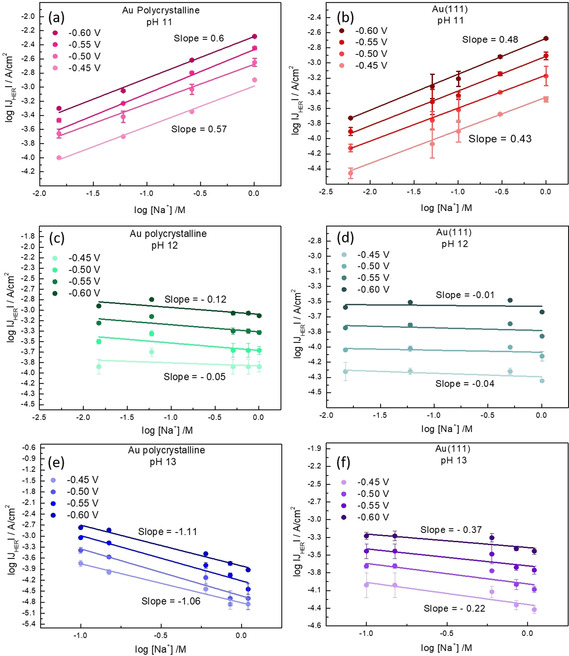
Figure 2.

Reaction order plot of HER in the cation concentration at pH 11 on a) Au polycrystalline and b) Au(111), at pH 12 on b) Au polycrystalline and d) Au(111) and at pH 13 on e) Au polycrystalline and f) Au(111), at 50 mV potential steps (vs. RHE) plotted as a function of the logarithm of the current density on the y‐axis and logarithm of the [Na+] concentration on the x‐axis. The corresponding slopes (reaction orders) are indicated next to the plots, where the slope at the bottom corresponds to the applied potential of −0.45 V (vs. RHE) and the slope at the top corresponds to the applied potential of −0.60 V (vs. RHE) in all the graphs.
