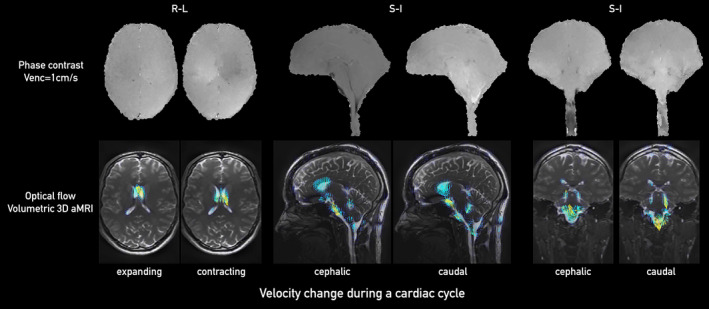
FIGURE 6.

Comparison between PC‐MRI (top) and optical flow maps calculated from volumetric 3D aMRI (bottom) for sagittal (left two panels), coronal (middle two panels), and axial (right two panels) planes. Here, we show the pair of 12th and 19th phases of a cardiac cycle (the same total number of 20 phases collected for each of the PC‐MRI and volumetric 3D aMRI methods). The optical flow maps capture the relative brain tissue deformation over time and the physical change in shape of the ventricles by the relative movement of the surrounding tissues
