
Fig 6.
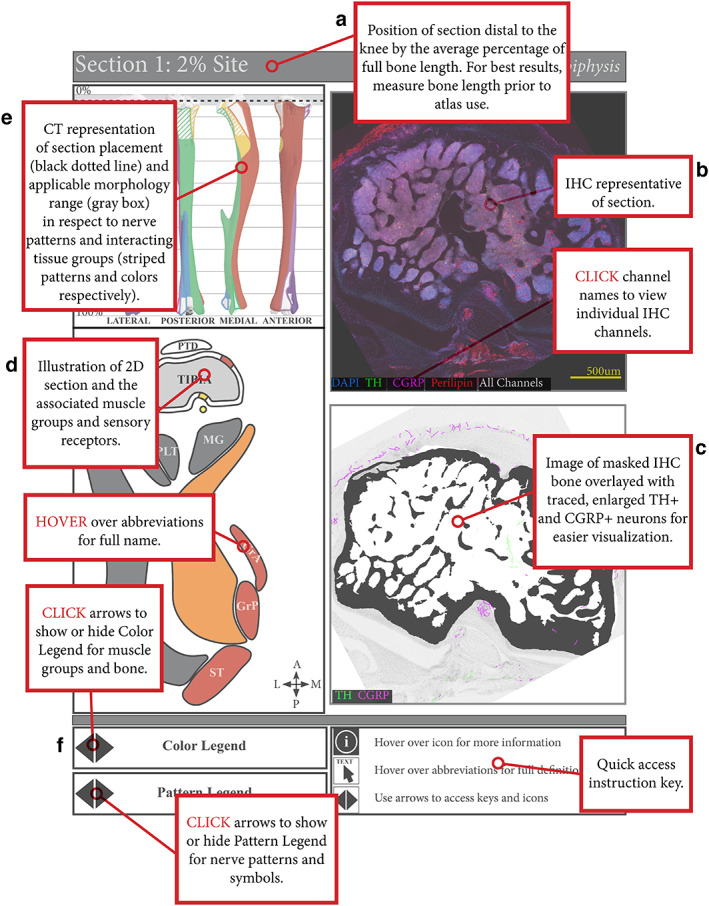
Mouse limb atlases—guide for use. (A) The four supplemental atlases comprise systematic analyses of serial, transverse cross sections down the length of the femur and tibia in B6 and C3H mice, where each page details a section of the bone at a particular percent distance from the knee. This includes (B) representative confocal projections of immunohistochemically labeled CGRP+ sensory and TH+ sympathetic nerve fibers, along with perilipin+ adipocytes and DAPI‐stained nuclei, in and around the bone and (C) corresponding bone‐masked, axon‐traced overlays to highlight and visualize the neuroskeletal features. (D) In addition, the atlas contains 2D reference maps with pattern‐coded periosteal innervation patterns superimposed on the bone interface and related to color‐coded muscle groups and individual muscle identities. (E) Lastly, these 2D maps served as the basis for 3D mapping of periosteal innervation patterns and color‐coded muscle groups onto the lateral, posterior, medial, and anterior aspects of the corresponding bone. (F) Instructions for accessing interactive features are located at the bottom of the page, such as displaying innervation pattern legend, muscle group color legend, and full muscle identifiers, or toggling through confocal channels.