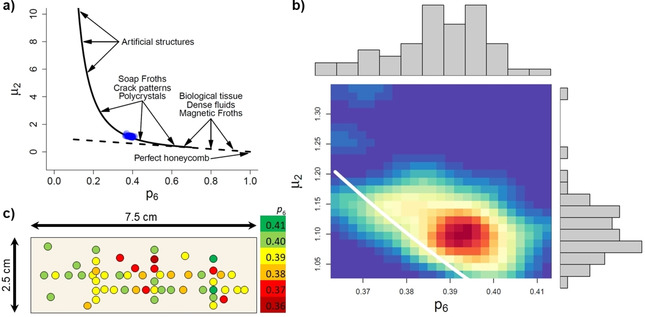
Figure 3.

a) Lemaitre's plot for all the data to show the exact location of the experiment (blue dots). The solid and dashed curves follow Eqs. (1) and (2), respectively. For comparison, the regions of location of other natural and artificial patterns are indicated in the plot. b) Same as panel a) but zoomed and aggregated as a heat map. c) Heat map of the mica surface, linking the obtained p 6 values to the locations of the corresponding AFM images.
