
Figure 4.
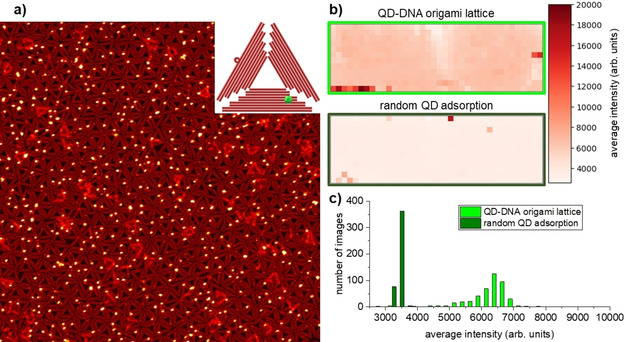
a) AFM image (2.5×2.5 μm2) of the QD‐decorated DNA origami lattice. The inset shows a scheme of the DNA origami triangle with a bound QD. b) Heat maps of the QD‐decorated DNA origami lattice depicted in the AFM image in a) and a DNA‐free control sample after random QD adsorption showing the lateral variation of the QD fluorescence intensities over almost the entire 7.5×2.5 cm2 surfaces (∼7×2 cm2 area imaged as the areas close to the edges of the mica substrate were neglected). c) Histograms of the recorded fluorescence intensities for the samples shown in b). For each sample, 456 fluorescence microscopy images have been analyzed.