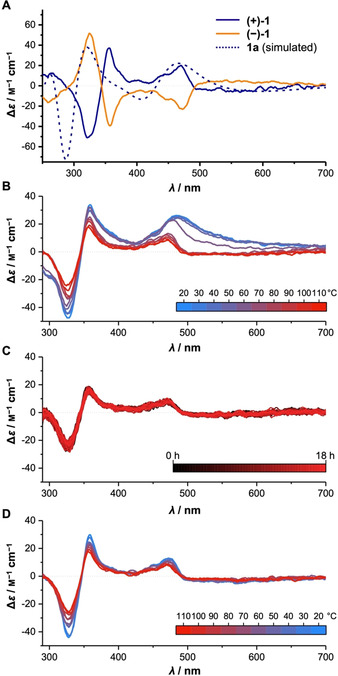
Figure 5.

A) Electronic circular dichroism (ECD) spectra of (+)‐1 and (−)‐1 (CHCl3, 20 °C) with spectrum simulated for enantiomer 1 a (sTDA‐xTB level out of 100 snapshots of a GFN2‐xTB/GBSA(toluene) MD‐simulation of 100 ps length); B–D) ECD‐spectra of (+)‐1 (3.34×10⁻⁵ m in PhCl) during (B) heating at a rate of 2 °C min−1, (C) holding the temperature at 110 °C and (D) cooling at a rate of 2 °C min−1.
