Figure 7.

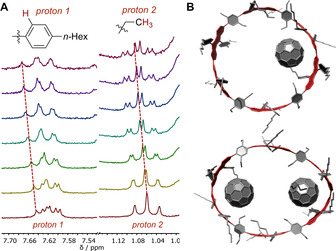
A) Selected regions of 1H NMR spectra during titration of (+)‐1 with C60 (0 to 12 equiv. from bottom to top, [D8]toluene, 300 MHz, 300 K); B) Calculated equilibrium structures of 1⊃C60 (GFN2‐xTB/GBSA (toluene)).

A) Selected regions of 1H NMR spectra during titration of (+)‐1 with C60 (0 to 12 equiv. from bottom to top, [D8]toluene, 300 MHz, 300 K); B) Calculated equilibrium structures of 1⊃C60 (GFN2‐xTB/GBSA (toluene)).