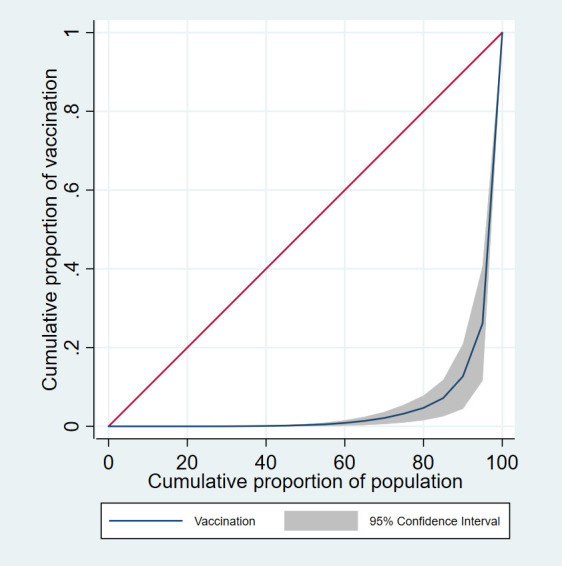
Figure 1.

COVID-19 vaccination Lorenz curve. The cumulative proportion of vaccines is shown on the vertical (Y) axis, and the cumulative proportion of the population is shown on the horizontal (X) axis. When the vaccine distribution is perfectly equal, and the proportions of vaccines and population are equal, then equality exists, and the Lorenz curve is a straight diagonal line with a slope of 1 (45 degrees); otherwise, the Lorenz curve lies underneath the diagonal line and indicates inequality exists.
