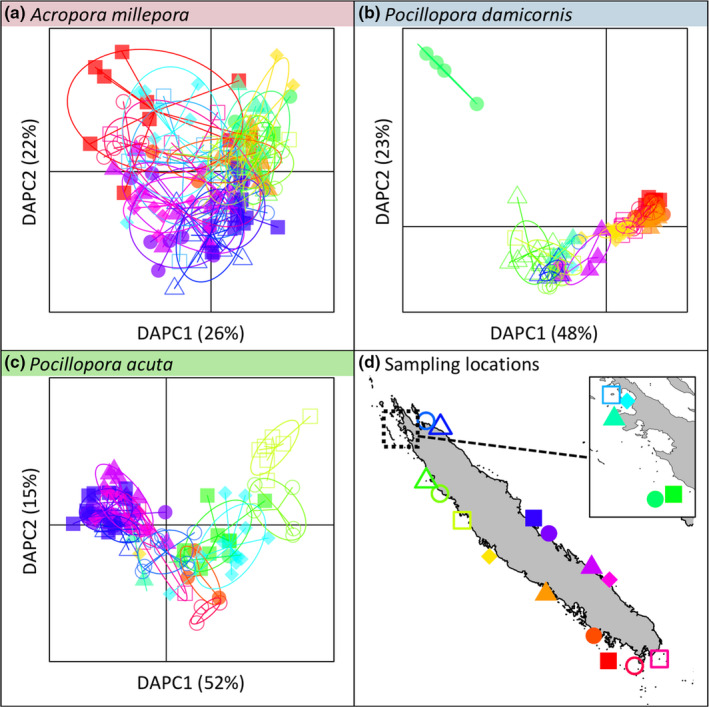
FIGURE 2.

Discriminant analysis of principal components (DAPC) of the genotype matrices for three species studied: Acropora millepora (a), Pocillopora damicornis (b) and Pocillopora acuta (c). Each scatterplot displays the distribution of samples across the first two discriminant functions of the DAPC (with the percentage of variance explained, in parentheses). DAPC was performed with a priori information on sampling locations. Symbols correspond to the sampling location of samples and the position of these locations are displayed in (d)
