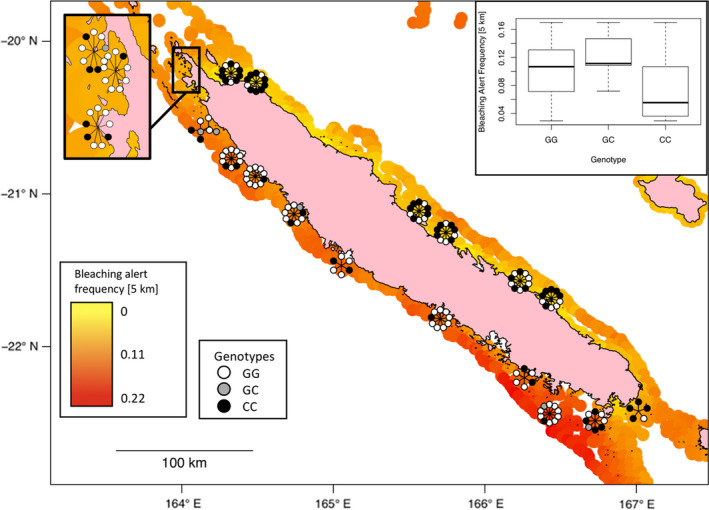
FIGURE 3.

Example of significant genotype–environment associations. The map displays the superposition between environmental gradient (here the frequency of bleaching alert since 1981, measured at 5‐km resolution) and the distribution of an associated (q <.01) SNP of Acropora millepora. Every circle corresponds to the SNP genotype for an individual colony. For illustrative reasons, genotypes are radially distributed around the sampling locations. The boxplot in the top‐right corner shows how the environmental variable distributes within each genotype. The SNP represented here is located on chromosome 2 (position 15023481) of the A. millepora genome, and the closest annotated gene codes for the mitochondrial MICOS complex subunit MIC60
