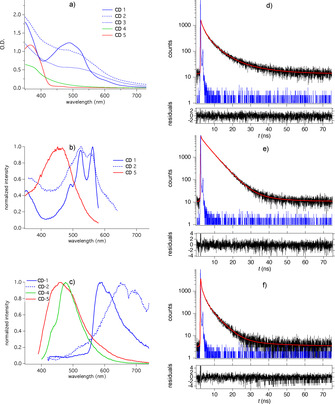
Figure 1.

Absorption (a), fluorescence excitation (b), and fluorescence emission (c) spectra obtained in DMSO using different CDs. Excitation occurred at 376 nm to record emission spectra while the emission was kept at 700 nm taking excitation spectra complemented with fluorescence decay curves obtained in the case of CD‐1 recorded at d) 520 nm, e) 600 nm, and f) 720 nm applying 376 nm diode laser excitation. The residuals base on an exponential fit with two linked species, see Table 1.
