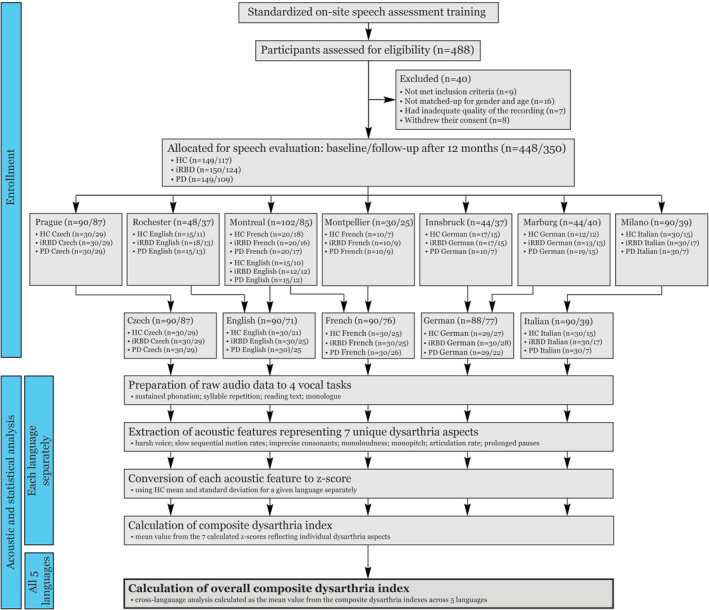
FIGURE 2.

Scheme depicting enrollment of research subjects and process of acoustic and statistical analysis of speech data. HC = healthy controls; iRBD = idiopathic rapid eye movement sleep behavior disorder; PD = Parkinson disease. [Color figure can be viewed at www.annalsofneurology.org]
