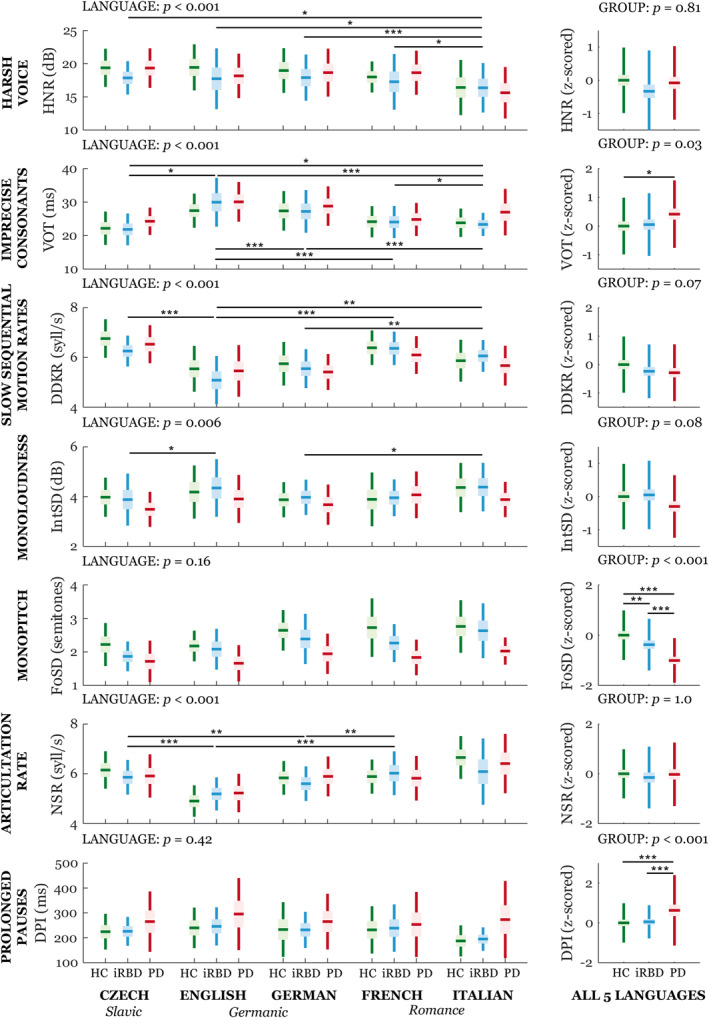
FIGURE 4.

Boxplots of individual acoustic speech dimensions across 5 languages. Horizontal lines represent the means, boxes represent 95% confidence interval, and whiskers represent the standard deviation. GROUP and LANGUAGE represent main effects; no GROUP × LANGUAGE interaction was detected. Statistically significant differences between groups or languages after Bonferroni adjustment were: *p < 0.05, **p < 0.01, ***p < 0.001. All results are adjusted for age, sex, and study site. DDKR = diadochokinetic rate; DPI = duration of pause intervals; F0SD = fundamental frequency variability; HC = healthy controls; HNR = harmonics‐to‐noise ratio; IntSD = intensity variability; iRBD = idiopathic rapid eye movement sleep behavior disorder; NSR = net speech rate; PD = Parkinson disease; VOT = voice onset time. [Color figure can be viewed at www.annalsofneurology.org]
