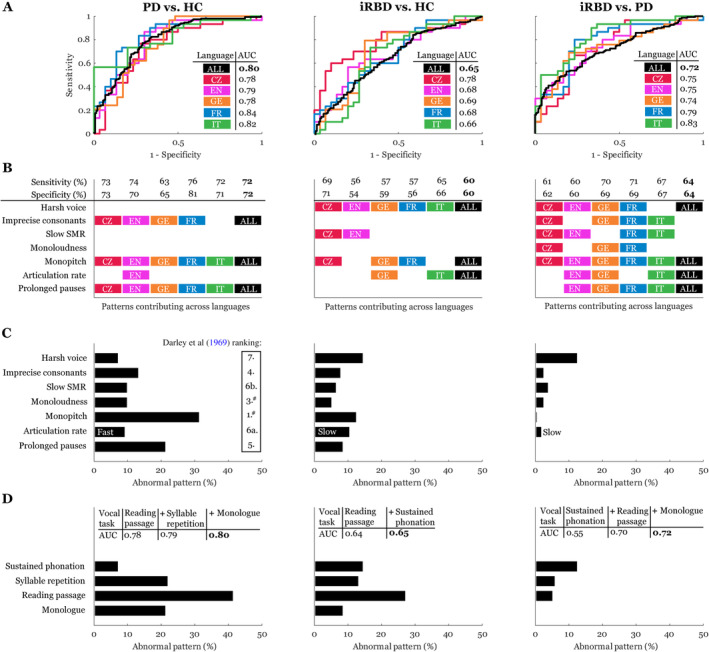
FIGURE 5.

Sensitivity analysis across 5 languages. The left panels are for PD versus HC, the middle are for iRBD versus HC, and the right are for iRBD versus PD. (A) Receiver operating characteristic curves with the listed AUC. (B) Speech patterns contributing to the best sensitivity/specificity across languages. (C) Percentage of abnormal patterns according to individual dysarthric components across all 5 languages based on comparison to the 95th percentile of healthy (left and middle panels) or PD (right panel) speech performance. (D) Percentage of abnormal patterns according to individual vocal tasks across all 5 languages based on comparison to the 95th percentile of healthy (left and middle panels) or PD (right panel) speech performance. The tables list cumulative AUCs across different numbers of vocal tasks. #The second most distinctive speech dimension of reduced stress can hardly be measured by automated acoustic analysis; however, monopitch and monoloudness contribute substantially to perceived reduced stress in PD. ALL = all 5 languages; AUC = area under the curve; CZ = Czech; EN = English; FR = French; GE = German; iRBD = idiopathic rapid eye movement sleep behavior disorder; IT = Italian; PD = Parkinson disease; SMR = sequential motion rate. [Color figure can be viewed at www.annalsofneurology.org]
