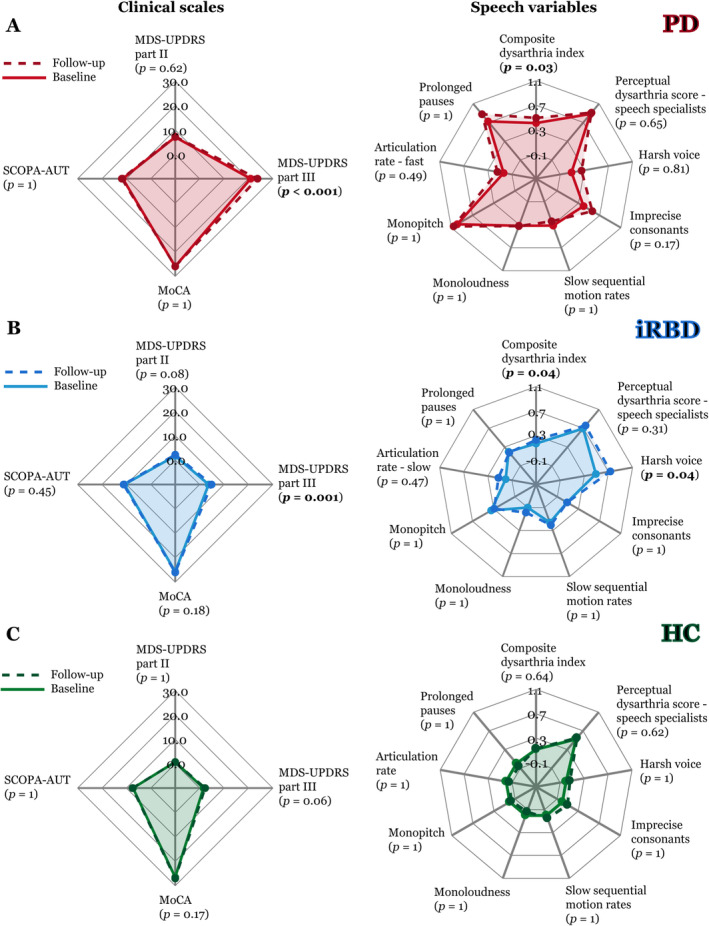
FIGURE 6.

Speech progression analysis from baseline (continuous line) to follow‐up (dashed line) across all 5 languages depicted using a spider plot for: (A) PD, (B) iRBD, and (C) controls. The lines demonstrate the mean values for clinical scales (left panels) and mean z‐scored values of speech variables (right panels); a higher number indicates more vocal impairment. All p‐values between follow‐up and baseline are listed after Bonferroni adjustment. HC = healthy controls; iRBD = idiopathic rapid eye movement sleep behavior disorder; MDS‐UPDRS = Movement Disorders Society‐Unified Parkinson's Disease Rating Scale; MoCA = Montreal Cognitive Assessment; PD = Parkinson disease; SCOPA‐AUT = Scales for Outcomes in Parkinson's Disease‐Autonomic Dysfunction. [Color figure can be viewed at www.annalsofneurology.org]
