
FIGURE 2.
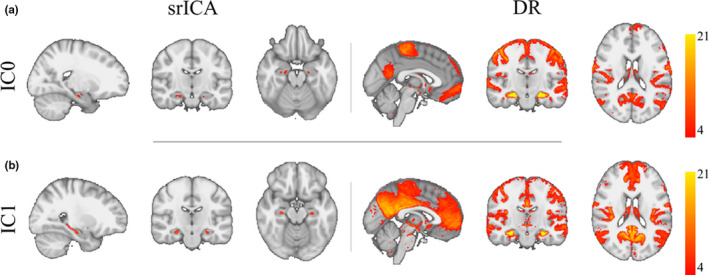
Results from group spatial ICA restricted to the hippocampal region (left panels under heading srICA) and Dual Regression (right panels under heading DR) in the two detected ICs (a,b). The maps under DR show whole‐brain group‐level FC maps using the hotspots detected using the ICs as seeds. Note that IC0 correlated with the somatomotor network and IC1 with the default mode network. IC and FC maps are corrected and thresholded Z maps at Z > 4