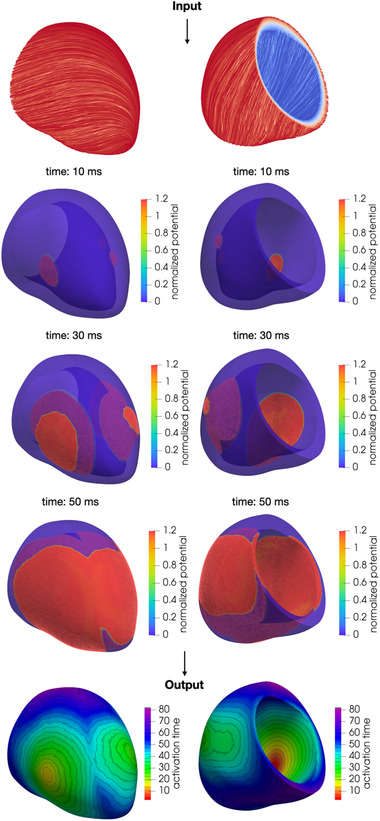
FIGURE 4.

Numerical simulation of the transmembrane potential in sinus rhythm and activation map obtained as a post‐processing of the numerical simulation [Color figure can be viewed at wileyonlinelibrary.com]

Numerical simulation of the transmembrane potential in sinus rhythm and activation map obtained as a post‐processing of the numerical simulation [Color figure can be viewed at wileyonlinelibrary.com]