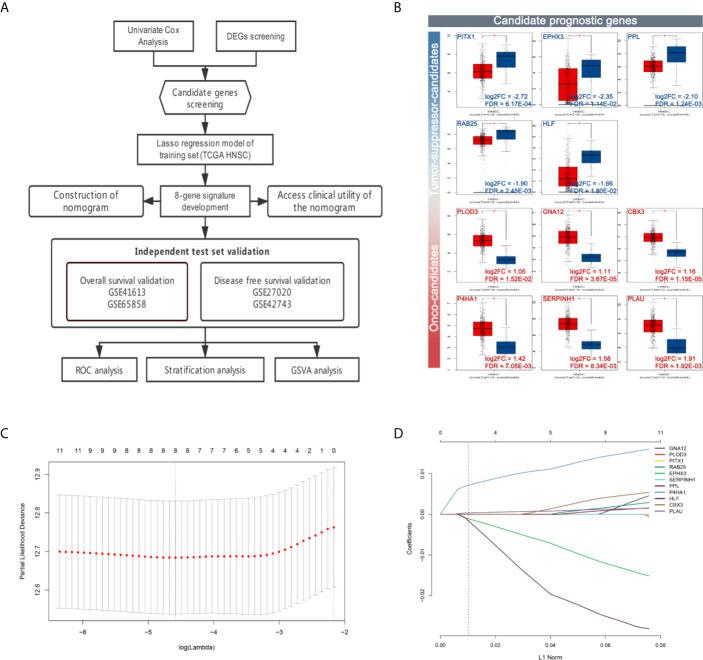
Figure 1.
Workflow and construction of LASSO Cox regression model. (A) Work flow of the study. (B) Expression of the candidate prognostic genes. (C) The LASSO coefficients profiles of 11 candidate prognostic genes. (D) Tuning parameter (λ) selection cross-validation error curve. The vertical lines were drawn at the optimal values by the minimum criteria and the 1-SE criteria. We choose the right line by 1-SE criteria where the eight-gene signature was selected.

