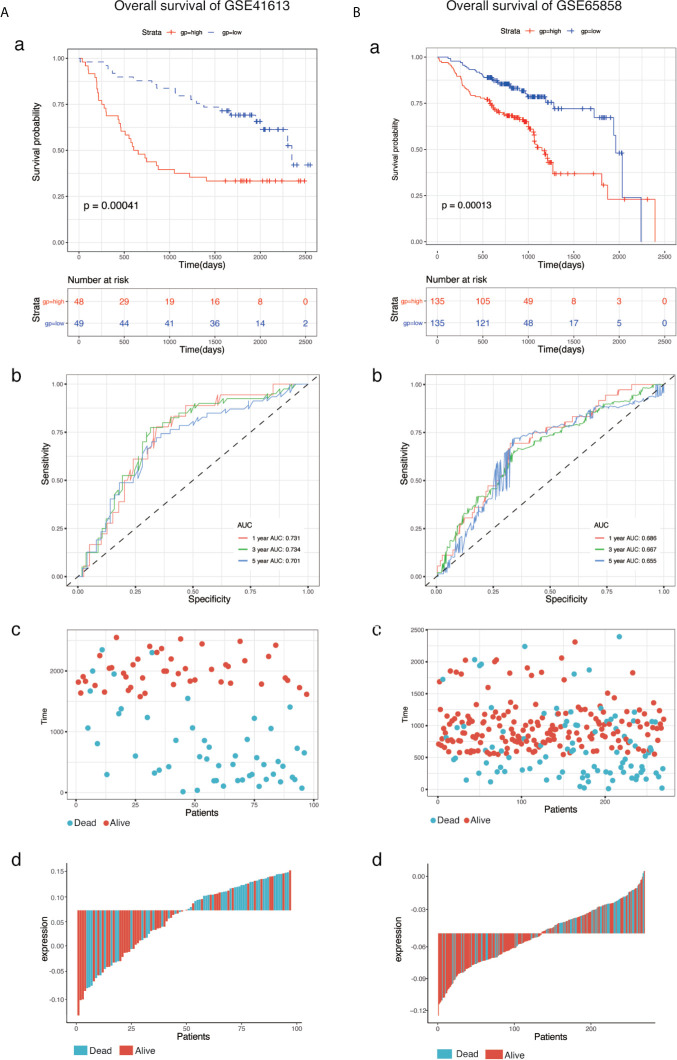
Figure 3.
KM survival, risk score by eight-gene signature and time-dependent ROC curves in the OS validation datasets. (A) GSE41613, (B) GSE65858. (a) KM survival analysis between high- and low-risk samples. (b) Time-dependent ROC curve for overall survival of validation datasets, the AUC was assessed at 1, 3, and 5-years. (c) Relationship between survival time (day) and risk score rank. (d) Relationship between survival status and risk score rank.

