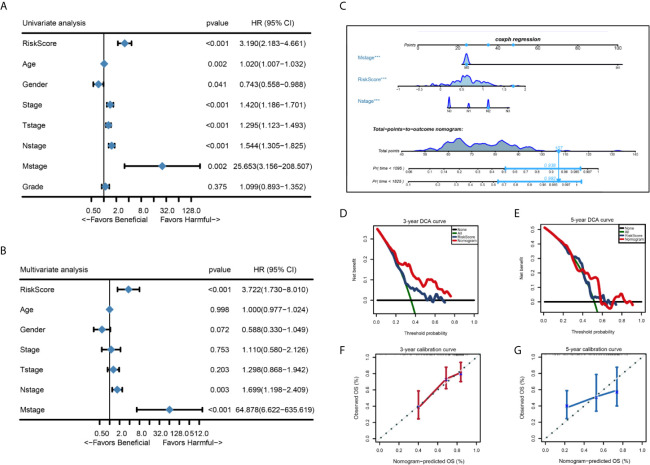
Figure 7.
Forest plot summary of univariate and multivariate analysis of 8-gene signature and nomogram to predict 3- and 5-year OS in TCGA-HNSC training set. (A, B) Univariable and multivariable analysis of OS for the TCGA-HNSC patients. The blue diamond squares on the transverse lines represent the HR and the gray transverse lines represent 95% CI. And the p value and 95% CI for each clinicopathological character were displayed in detail. (C) The nomogram for predicting proportion of patients with 3- or 5 - year OS. (D, E) Calibration curve for the prediction of 3- or 5- year overall survival. (F, G) DCA curve for the prediction of 3- or 5- year overall survival.

