. 2021 May 18:M21-0256. doi: 10.7326/M21-0256

Figure 2. The RBD IgG response by region.
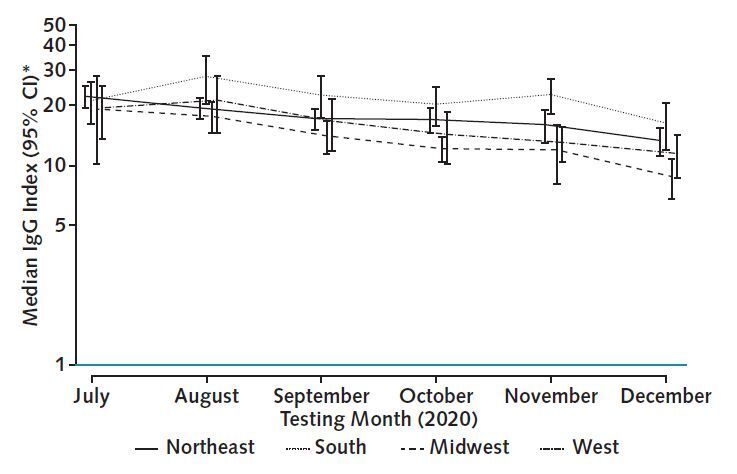
Figure 2. The RBD IgG response by region. The figure displays overall adjusted median RBD index values, stratified by region. Adjusted medians were similar by region in July. Regions with higher antecedent burden of COVID-19 cases and death (Northeast and Midwest) had a slow, steady decline in index values. In the South and West, the peak occurred in August, indicating proportionally more recent infections in these regions. Median values account for age, sex, and residence in a majority-minority neighborhood, defined as a majority Hispanic, Black, or Hispanic and Black neighborhood. RBD = receptor-binding domain. * Plotted on log scale.

The figure displays overall adjusted median RBD index values, stratified by region. Adjusted medians were similar by region in July. Regions with higher antecedent burden of COVID-19 cases and death (Northeast and Midwest) had a slow, steady decline in index values. In the South and West, the peak occurred in August, indicating proportionally more recent infections in these regions. Median values account for age, sex, and residence in a majority-minority neighborhood, defined as a majority Hispanic, Black, or Hispanic and Black neighborhood. RBD = receptor-binding domain.

* Plotted on log scale.