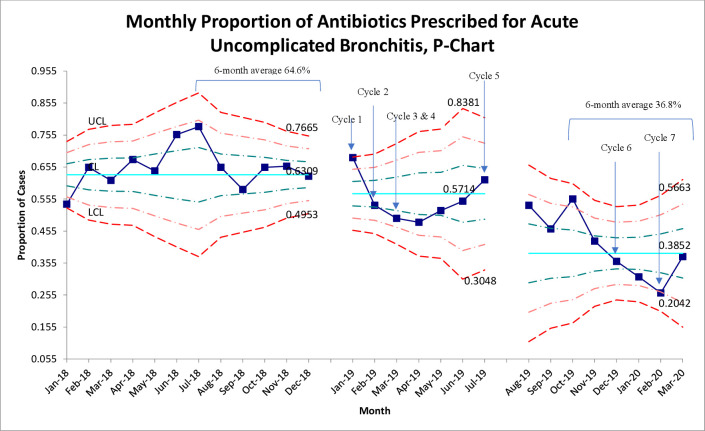
Figure 2.
SPC p-chart for monthly AUB/URI-NOS cases. *Χ2 comparison of the central limits of the three intervention periods had a p value=0.002. AUB, acute uncomplicated bronchitis; CL, control limit; LCL, lower control limit; NOS, not otherwise specified; SPC, Statistical Process Control; UCL, upper control limit; URI, upper respiratory tract infection.

