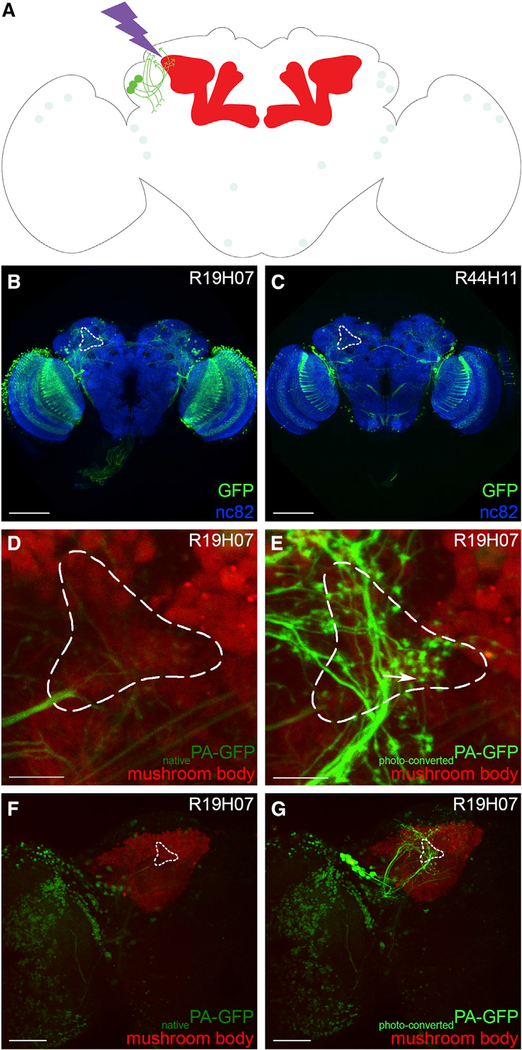
Figure 3. Anatomical Screen to Identify Transgenic Lines Driving Expression in the Neurons Projecting to the dACA.
(A) A schematic of the Drosophila brain shows how transgenic lines driving expression in potential dACA input neurons were identified by photo-labeling; the schematic shows the identification of a transgenic line driving expression in the PLPPNs as an example.
(B and C) First, the expression patterns of each of the transgenic lines available in the FlyLight database were inspected: transgenic lines clearly driving expression strongly (B; R19H07-GAL4) or weakly (C; R44H11-GAL4) in neurons projecting to or from the dACA (white dashed outline) were selected for further investigation. These images were obtained from the FlyLight website.
(D and E) The dACA (white dashed outline) of the mushroom body (red) was visualized in the selected lines, here R19H07-GAL4, and targeted for photo-activation by designing a mask that exposed the outlined region to high-energy light; transgenic lines driving expression in a few neurons extending clear axonal terminals in the dACA (E, arrow) were selected for further investigation.
(F and G) Before photo-labeling, weak fluorescence is visible in many different neurons (F), and upon photo-labeling, the neurons projecting to the dACA (white dashed outline) are visible (G).
The following genotype was used in (D)–(G): yw/yw;MB247-DsRedunknown,UAS-C3PA-GFPunknown/UAS-C3PA-GFPattP40;UAS-C3PAattP2,UAS-C3PAVK00005,UAS-C3PAVK00027/R19H07-GAL4attP2. Scale bars are 100 μm (B and C), 10 μm (D and E), and 50 μm (F and G).

