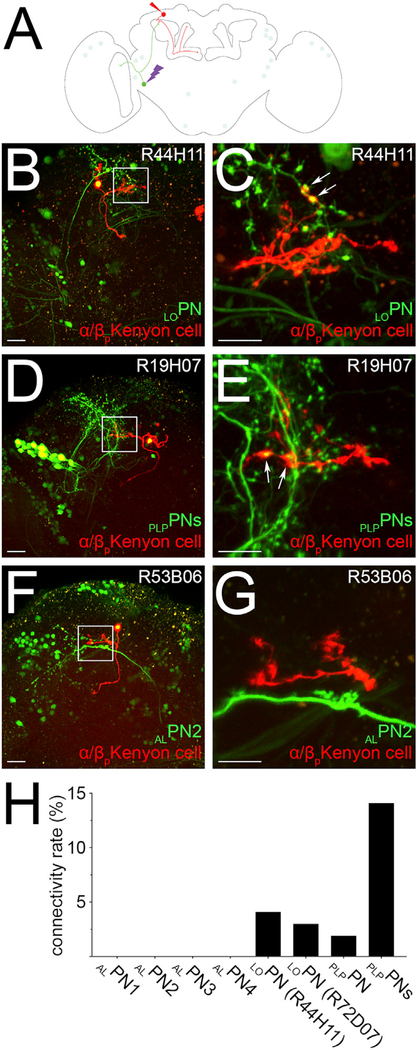
Figure 5. Frequency of Connections between the α/βp Kenyon Cells and Their Input Neurons.
(A) A schematic of the Drosophila brain shows how the frequency of connections between the α/βp Kenyon cells (red) and a given input neuron (green), here LOPN, was measured.
(B–G) A given input neuron was photo labeled (bright green), and a randomly chosen α/βp Kenyon cell was dye filled (red). The total number of claws formed by the dye-filled Kenyon cell was counted, and claws connecting to the axonal terminals of the photo-labeled neuron were detected (arrows). Such connections were found for LOPN (B and C; n = 27) and PLPPNs (D and E; n = 24), but not for the other neurons identified in this study, such as ALPN2 (F and G; n = 30).
(H) The frequency of connections between α/βp Kenyon cells and a given input neuron was calculated by dividing the number of connections detected (for instance, arrows in C and E) by the total number of claws sampled for that particular input neuron.
The following genotype was used in this figure: yw/yw;UAS-C3PA-GFPunknown/UAS-SPA-GFPattP40; R13F02-GAL4ADVK00027,R85D07-GAL4DBDattP2/R_line (as indicated in the panel)-GAL4attP2. Scale bars are 20 μm (B, D, and F) and 10 μm (C, E, and G).

