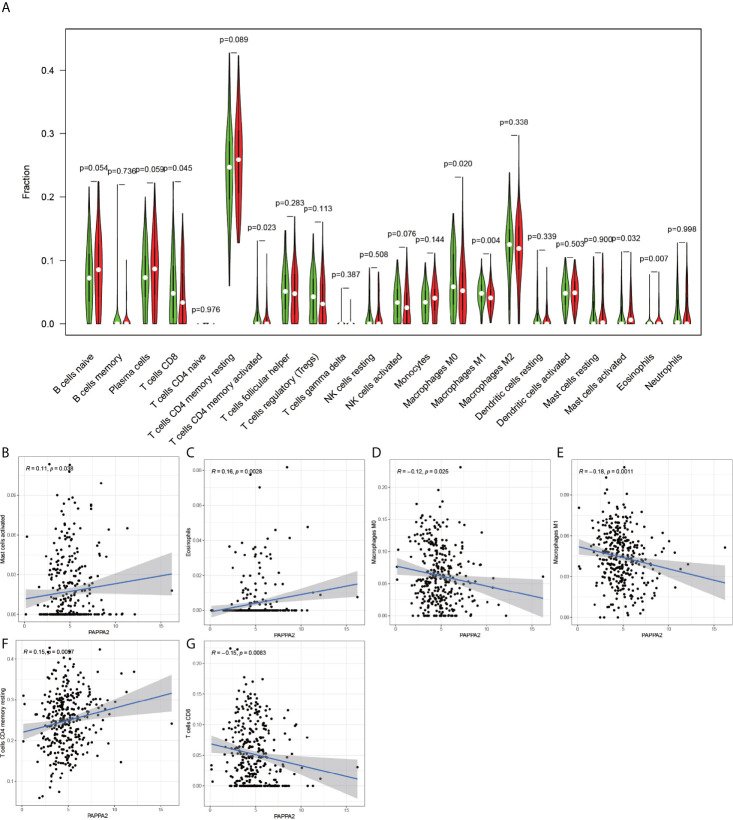
Figure 14.
PAPPA2-based immune cell analysis. The (A) graph shows that there are 6 immune cells associated with PAPPA2 in gastric cancer (P-value < 0.05). (B, C, F) plots indicate that these three immune cells are positively correlated with PAPPA2. (D, E, G) plots indicate that these three immune cells are negatively correlated with PAPPA2.

