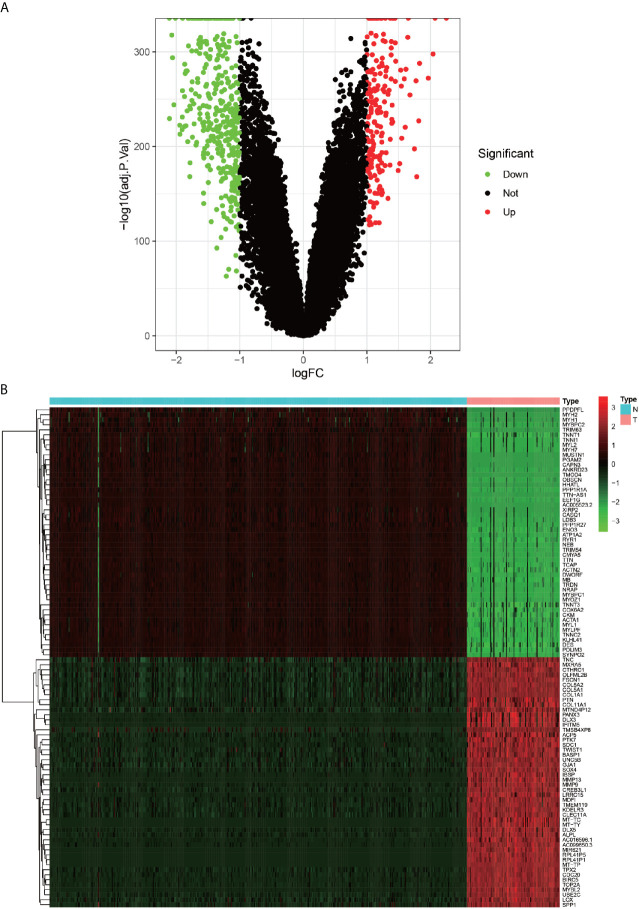
Figure 2.
Heat map and volcano map of differentially expressed genes. (A) green dots indicate down-regulated differential genes, red dots indicate up-regulated differential genes, and black dots indicate other genes that do not meet the screening criteria. (B) Heat map of differentially expressed genes, red squares indicate highly expressed genes.

