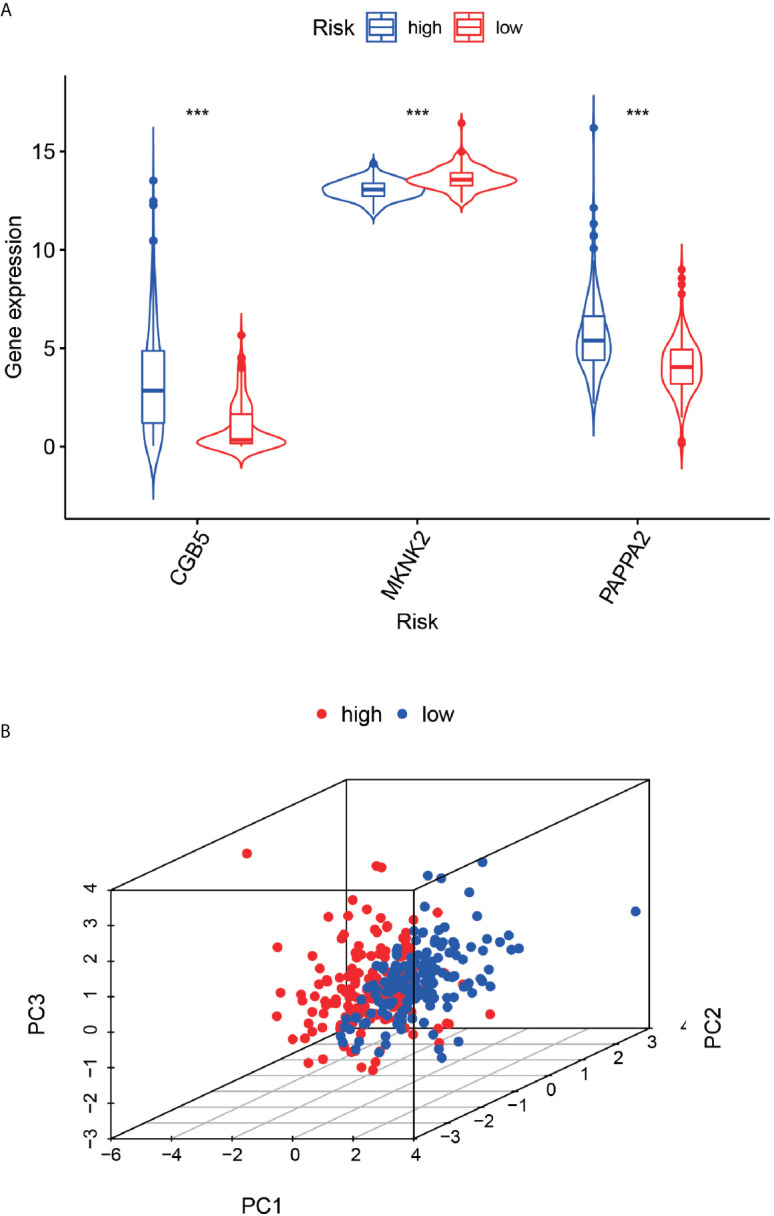
Figure 7.

Expression differences between high and low risk groups and principal component analysis. The (A)-plot represents the difference in gene expression values of the three genes based on the high and low risk of the constructed model. The (B)-plot represents the principal component analysis based on high and low risk, high risk group and low risk group. ***P < 0.001.
