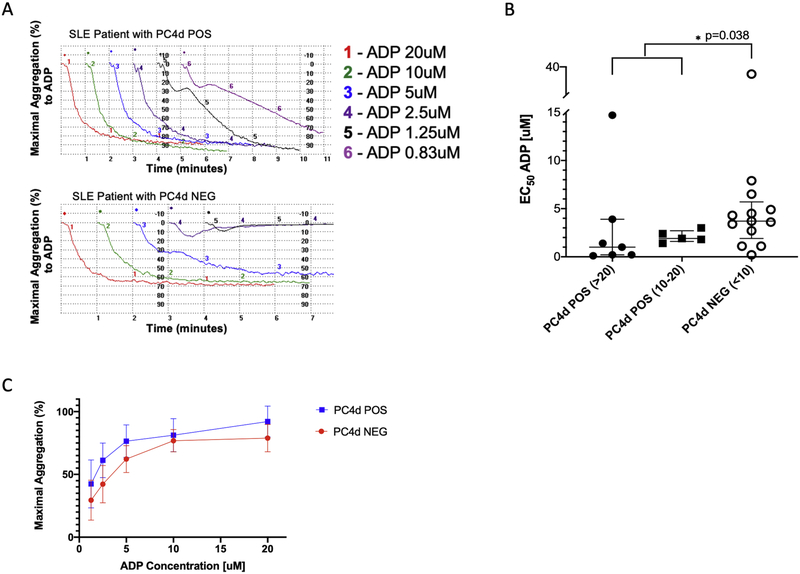
Figure 4: PC4d POS (PC4d≥10) platelets, as compared with PC4d NEG (PC4d≥10) platelets, aggregate more in response to addition of ADP agonist.
A, Representative platelet aggregation curves from a PC4d POS patient (top) and a PC4d NEG patient (bottom). Decreasing concentrations of ADP agonist were added to platelet rich plasma and the aggregation response was recorded for six minutes. B, Platelet aggregation was analyzed as EC50, expressed as the ADP concentration [uM] that achieves 50% of the maximal aggregation. A lower EC50 indicates greater platelet sensitivity to the addition of the platelet aggregation agonist. C, Maximal platelet aggregation response after the addition of 20, 10, 5 and 2.5uM ADP agonist. Bars show the median ± interquartile range (IQR); comparisons were analyzed using the Mann-Whitney U two-sample test; Patients on aspirin were excluded.

