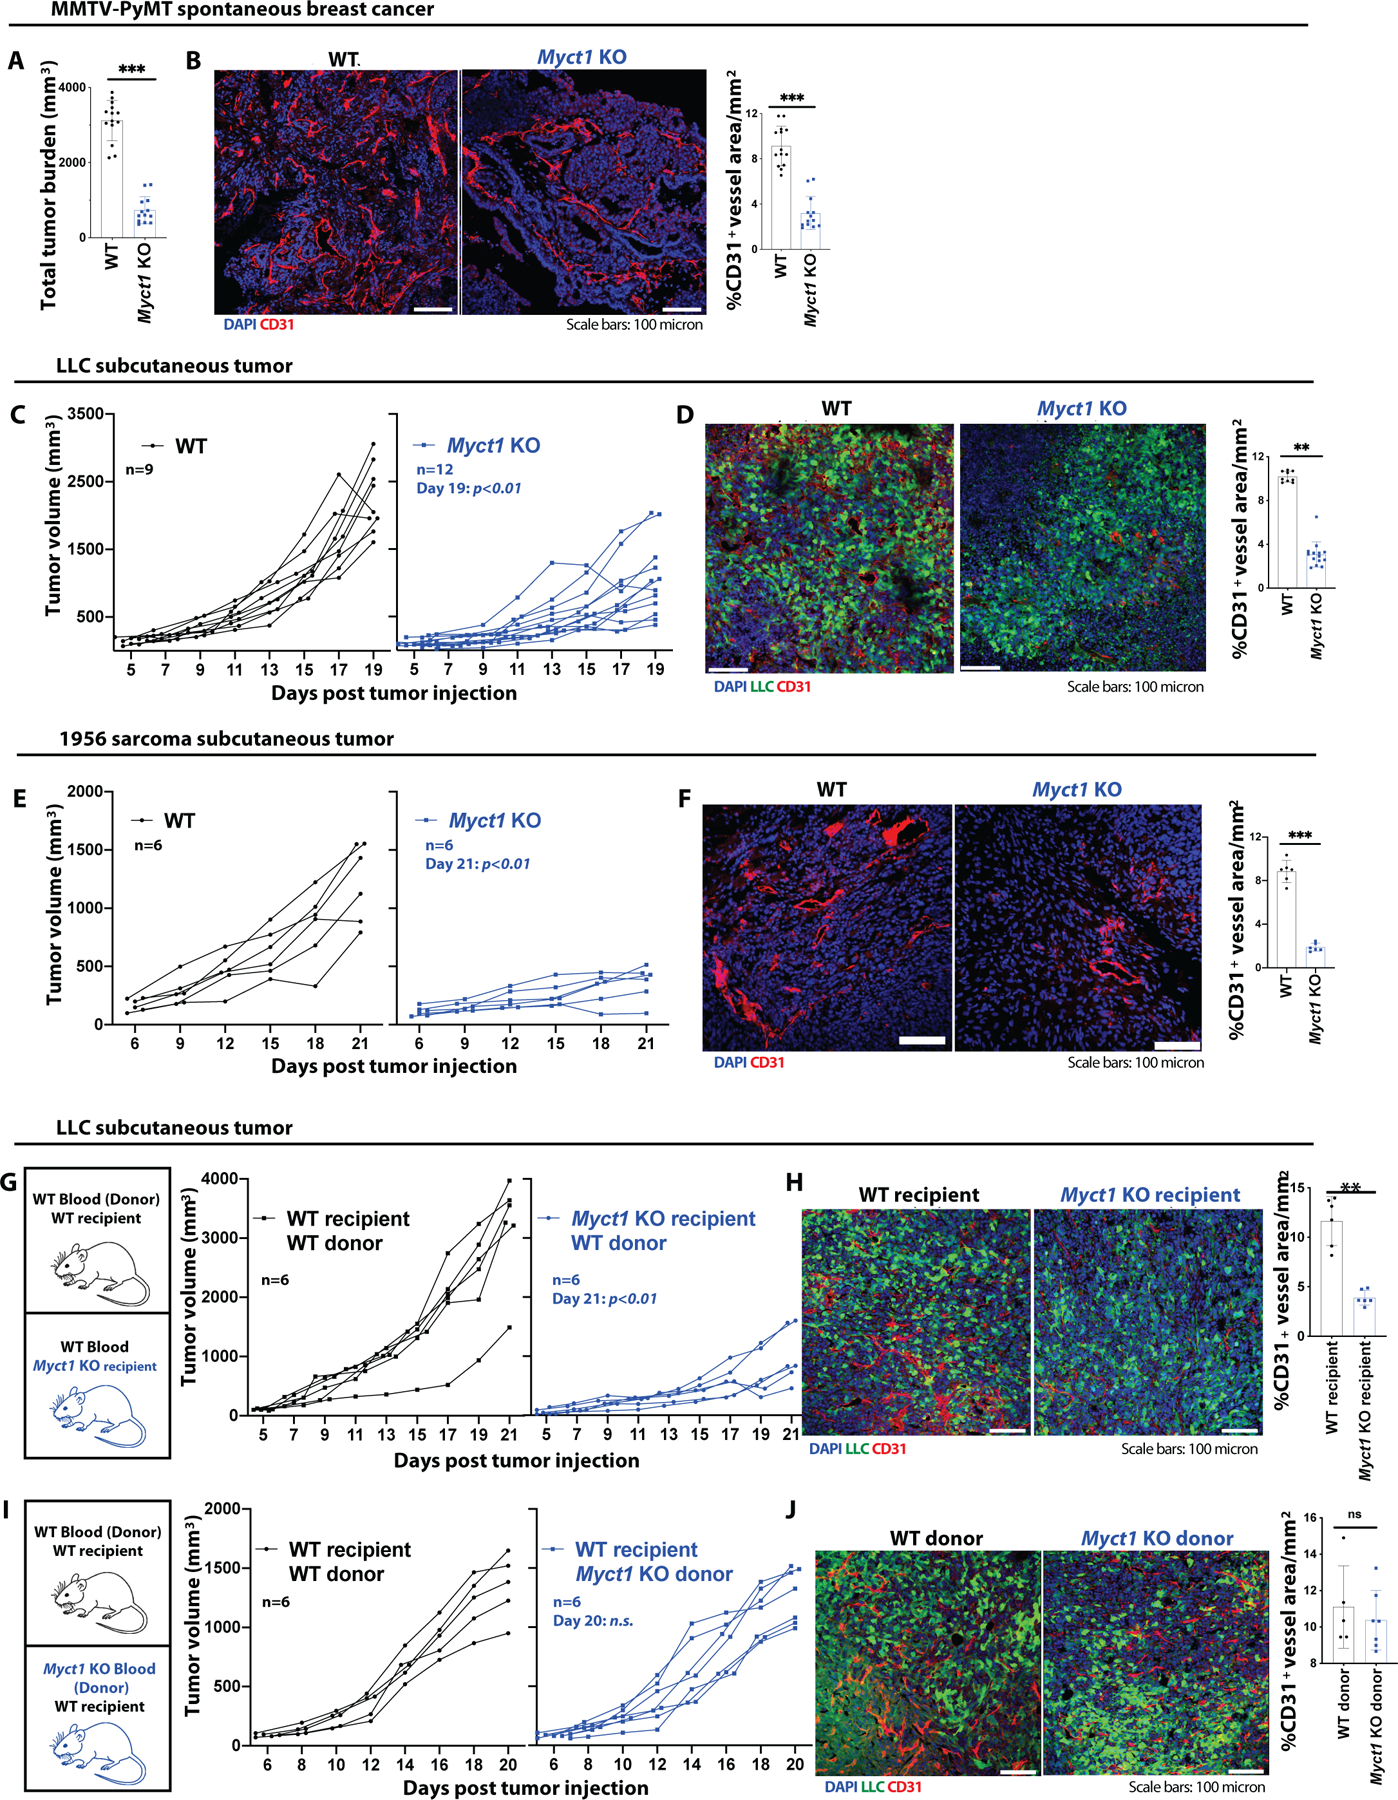
Figure 2: Endothelial Myct1 is required for tumor growth and angiogenesis in mice.

(A and B) Analysis of total tumor burden (A) and representative images with quantification of CD31+ vessel density (B) in WT and Myct1 KO MMTV-PyMT mice at 21 weeks of age. n=14 mice per group. Scale bars, 100μm. Data is presented as mean with SD. Statistical significance was analyzed by two-tailed Student’s t-test; ***p<0.001. (C, D) Analysis of LLC tumor growth (C) and representative images with quantification for CD31+ vessel density (D) in WT and Myct1 KO mice. Scale bars, 100μm. Data is presented as mean with SD from one of three biological replicates. Statistical significance was analyzed by two-tailed Student’s t-test; **p<0.01, at the end of the study. (E and F) Analysis of 1956-sarcoma tumor growth (E) and representative images with quantification for CD31+ vessel density (F) in WT and Myct1 KO mice. Scale bars, 100μm. Data is presented as mean with SD from one of three biological replicates. Statistical significance was analyzed by two-tailed Student’s t-test; **p<0.001, at the end of the study. (G-J) Analysis of tumor growths (G and I) and representative images with quantification for CD31+ vessel density (H and J) in stromal Myct1 KO (G and H) and hematopoietic Myct1 KO mice (I and J). Scale bars, 100μm. Data is presented as mean with SD. Statistical significance was analyzed by two-tailed Student’s t-test; n.s.=not significant and **p<0.01, at the end of the study.
