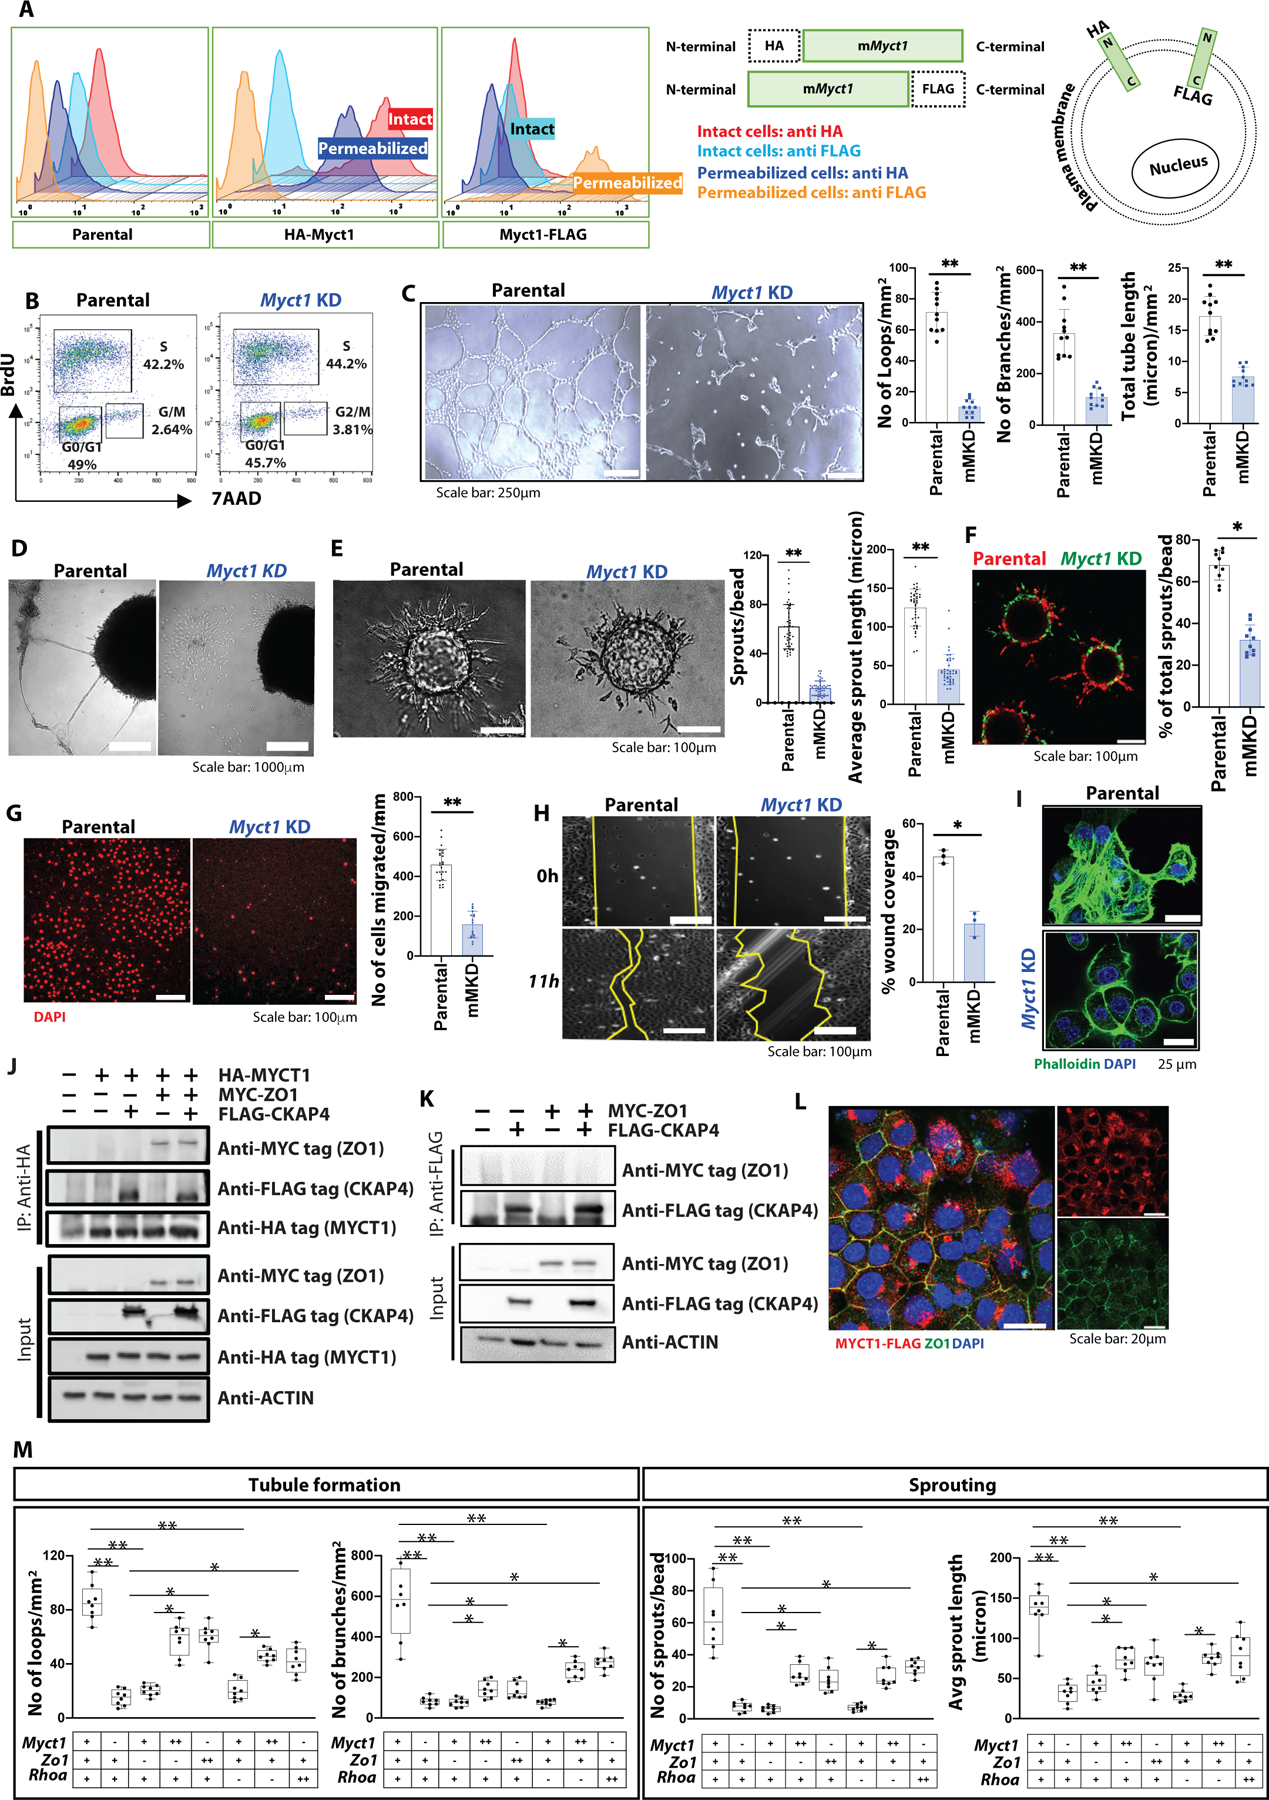
Figure 3: Membrane-localized MYCT1 regulates endothelial actin cytoskeleton dynamics in the angiogenic environment.

(A) (left) Flow cytometric analysis of HA- and FLAG-tagged MYCT1 overexpressing MCEC cells. (right) A graphical presentation of the HA- and FLAG-tagged MYCT1 protein situated at the plasma membrane. (B) A representative FACS chart of the BrdU proliferation assay with parental and Myct1 knockdown (KD) cells. (C) Representative images and quantifications from the Matrigel tube formation assay. n=12 independent observations per group. Scale bars, 250μm. Data is presented as mean with SD from one of three biological replicates. Statistical significance was analyzed by two-tailed Student’s t-test; **p<0.01. (D) Representative images from tumor-spheroid/EC co-culture assay. Scale bar, 1000μm. (E) Representative images and quantifications of sprouts from the fibrin gel sprouting assay. n≥32 independent observations per group. Scale bars, 100μm. Data is presented as mean with SD from one of three biological replicates. Statistical significance was analyzed by two-tailed Student’s t-test; **p<0.01. (F) Representative image and quantification of sprouts from the fibrin gel sprouting assay with 1:1 competitive seeding of parental (red) and Myct1 KD (green) MCEC cells on the beads. Scale bar, 100μm. Data is presented as mean with SD. Statistical significance was analyzed by two-tailed Student’s t-test; **p<0.05. (G) Representative images and quantifications of cell migration from the Boyden chamber assay. n≥12 independent observations per group. Scale bars, 100μm. Data is presented as mean with SD from one of three biological replicates. Statistical significance was analyzed by two-tailed Student’s t-test; **p<0.01. (H) Representative images and quantifications for recovery from the wound closure assay. n≥3 independent observations per group. Scale bars, 100μm. Data is presented as mean with SD from one of two biological replicates. Statistical significance was analyzed by two-tailed Student’s t-test; **p<0.05. (I) Representative immunofluorescence images of actin filaments in a cultured monolayer of MCEC cells. Scale bars, 25μm. (J) Immunoprecipitation followed by western blot (IP-WB) analysis for MYCT1 in the total cell lysates of the parental and HA-tagged MYCT1 overexpressing (HA-MYCT1) MCEC cells transfected with either mock (empty vector control) or MYC-tagged ZO1, and FLAG-tagged CKAP4 expression plasmids. An anti-ACTIN antibody was used as a control. (K) IP-WB analysis for CKAP4 in the total cell lysates of the parental MCEC cells transfected with either mock (empty vector control), or MYC-tagged ZO1, or FLAG-tagged CKAP4 expression plasmids. An anti-ACTIN antibody was used as a control. (L) Representative immunofluorescence image of ZO1 (green) and MYCT1 (anti-FLAG, red) in a confluent monolayer of FLAG-tagged MYCT1 overexpressing MCEC cells. Scale bars, 20μm. (M) Quantifications from the Matrigel tube formation assay (left) and fibrin gel sprouting assay (right) with different combinations of Myct1, Zo1, and Rhoa KD and overexpressing MCEC cells. “+”, “++”, and “−” denotes parental, overexpression, and knockdown cells, respectively. n≥6 independent observations per group. Data is presented as mean with SD from one of two biological replicates. Statistical significance was analyzed by One-way ANOVA with Tukey’s multiple comparison test; *p<0.05, **p<0.01.
