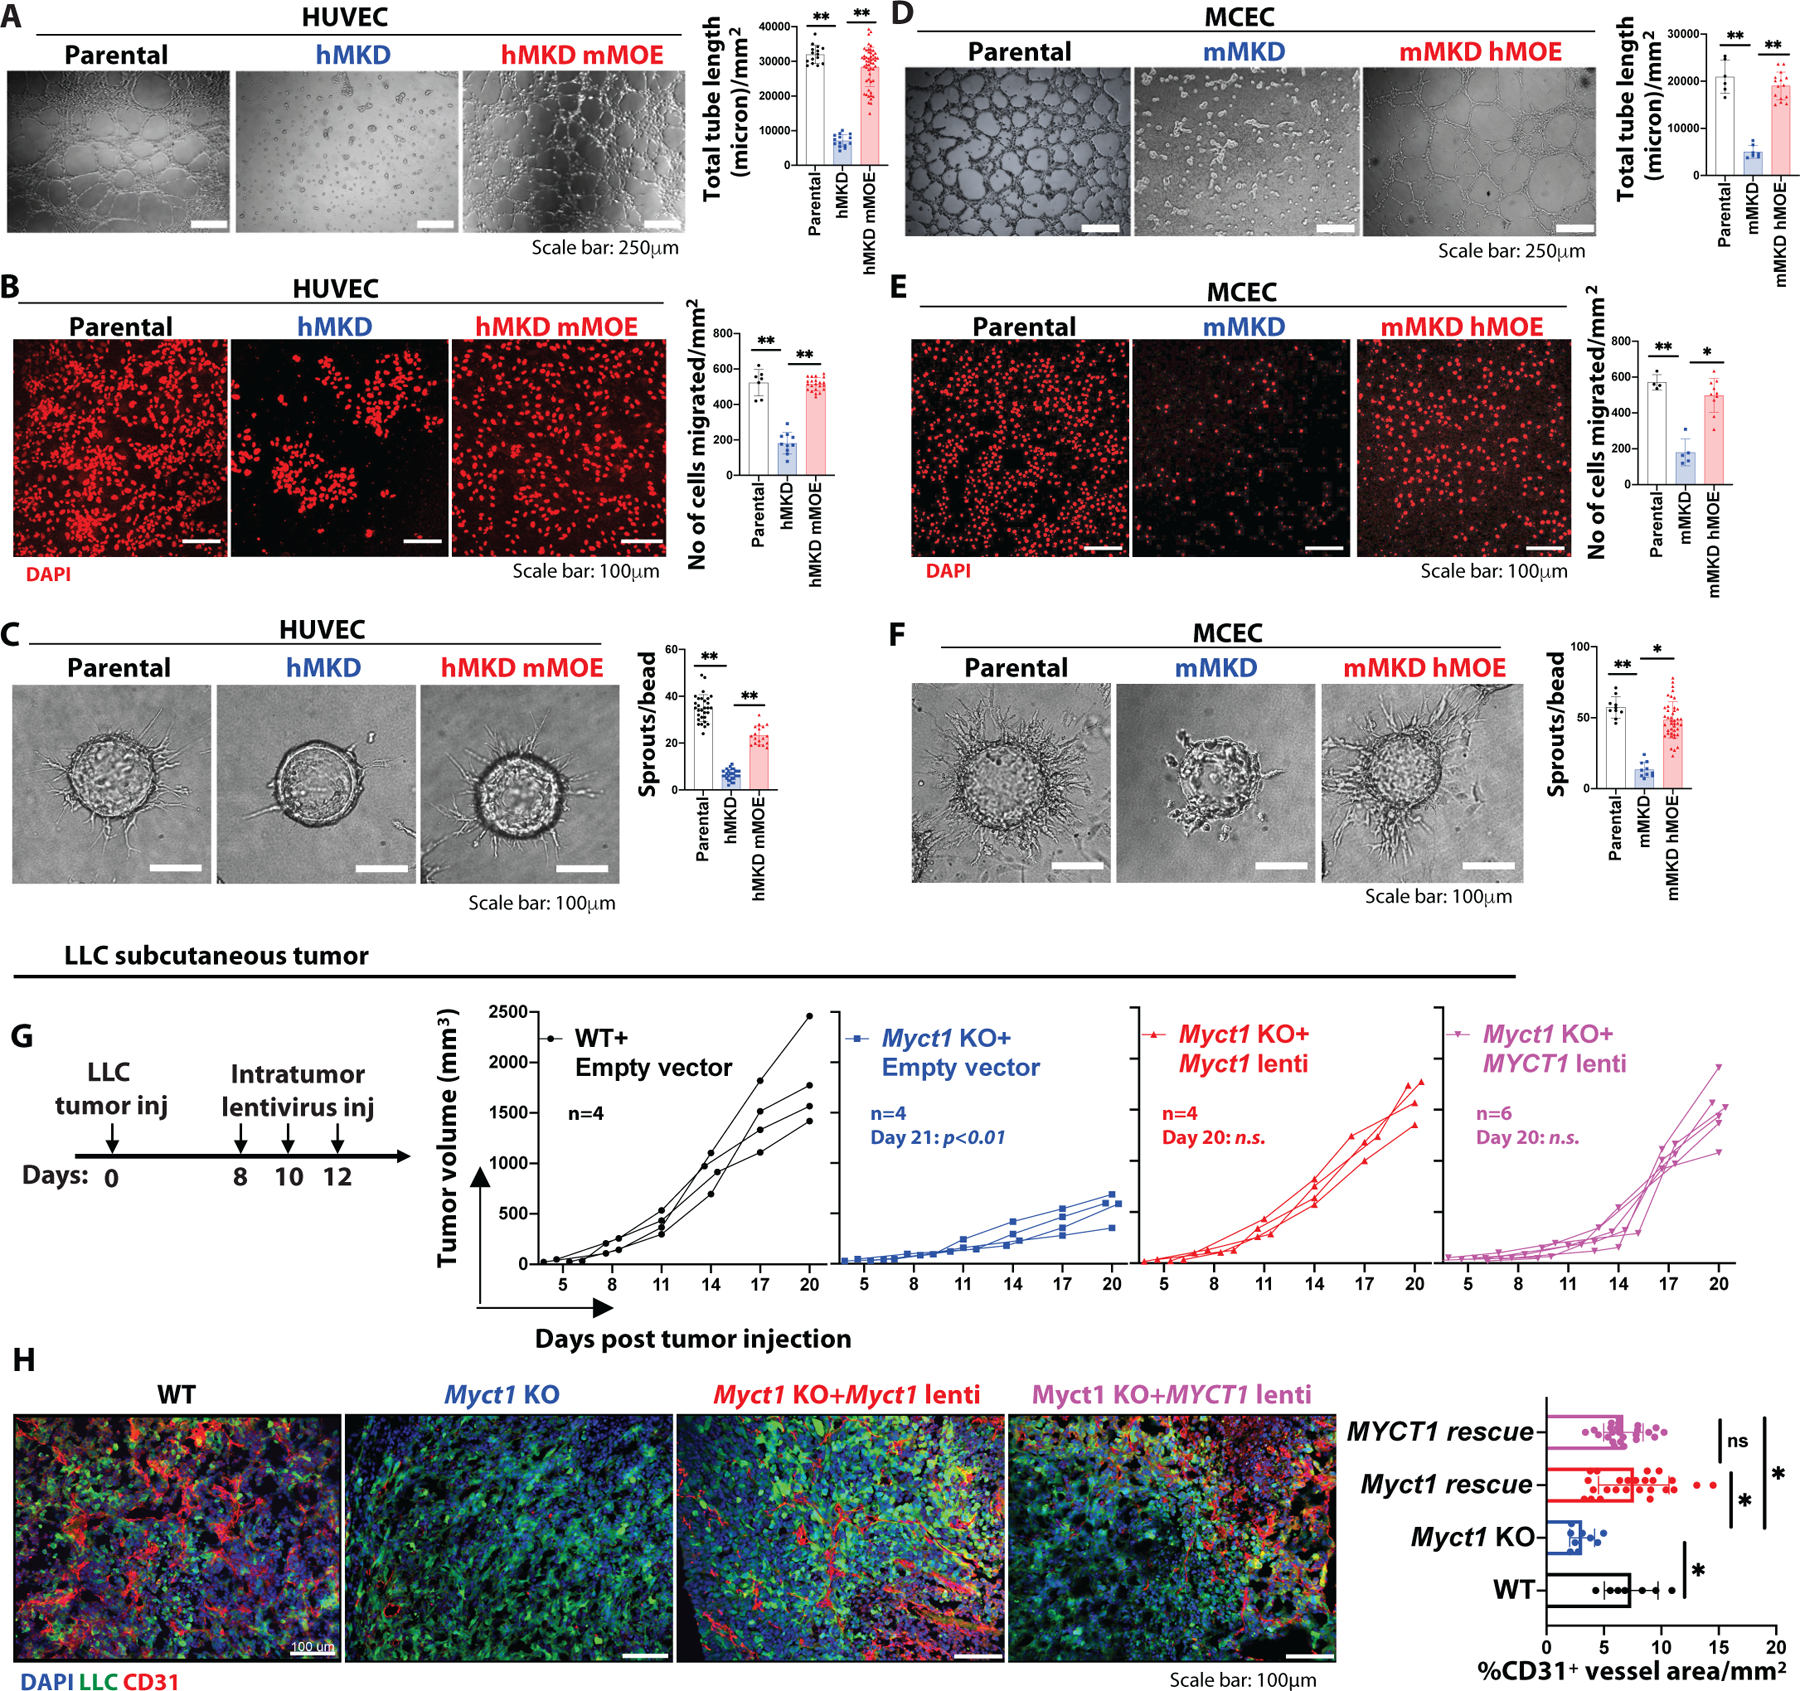
Figure 4: Endothelial MYCT1 function is evolutionarily conserved between human and mouse.

(A-C) Representative images and quantifications from the Matrigel tube formation assay (A), Boyden chamber migration assay (B), and fibrin gel bead sprouting angiogenesis assay (C) with parental, human MYCT1 KD (hMKD), and mouse Myct1 overexpressing human MYCT1 KD (hMKD mMOE) HUVEC cells. Scale bar, 250μm (A) and 100μm (B and C). n≥10 independent observations per group. Data is presented as mean with SD from one of three biological replicates. Statistical significance was analyzed by One-way ANOVA with Tukey’s multiple comparison test; **p<0.05. (D-F) Representative images and quantifications from the Matrigel tube formation assay (D), Boyden chamber migration assay (E), and fibrin gel sprouting assay (F) with parental, mouse Myct1 KD (mMKD), and human MYCT1 overexpressing mouse Myct1 KD (mMKD hMOE) MCEC cells. Scale bars, 250μm (D) and 100μm (E and F). n≥10 independent observations per group. Data is presented as mean with SD from one of three biological replicates. Statistical significance was analyzed by One-way ANOVA with Tukey’s multiple comparison test; *p<0.05 and **p<0.01. (G and H) Analysis of tumor growth (G) and representative immunofluorescence images with quantification for CD31+ vessel density (H) in PBS (control) and either mouse Myct1 or human MYCT1 lentiviral overexpression constructs (intra-tumor) treated WT and Myct1 KO mice. Scale bars, 100μm. Data is presented as mean with SD. Statistical significance was analyzed by One-way ANOVA with Tukey’s multiple comparison test; n.s.=not significant and *p<0.05, at the end of the study.
