
Figure 6: Myct1 deficiency promotes an immunostimulatory tumor microenvironment.
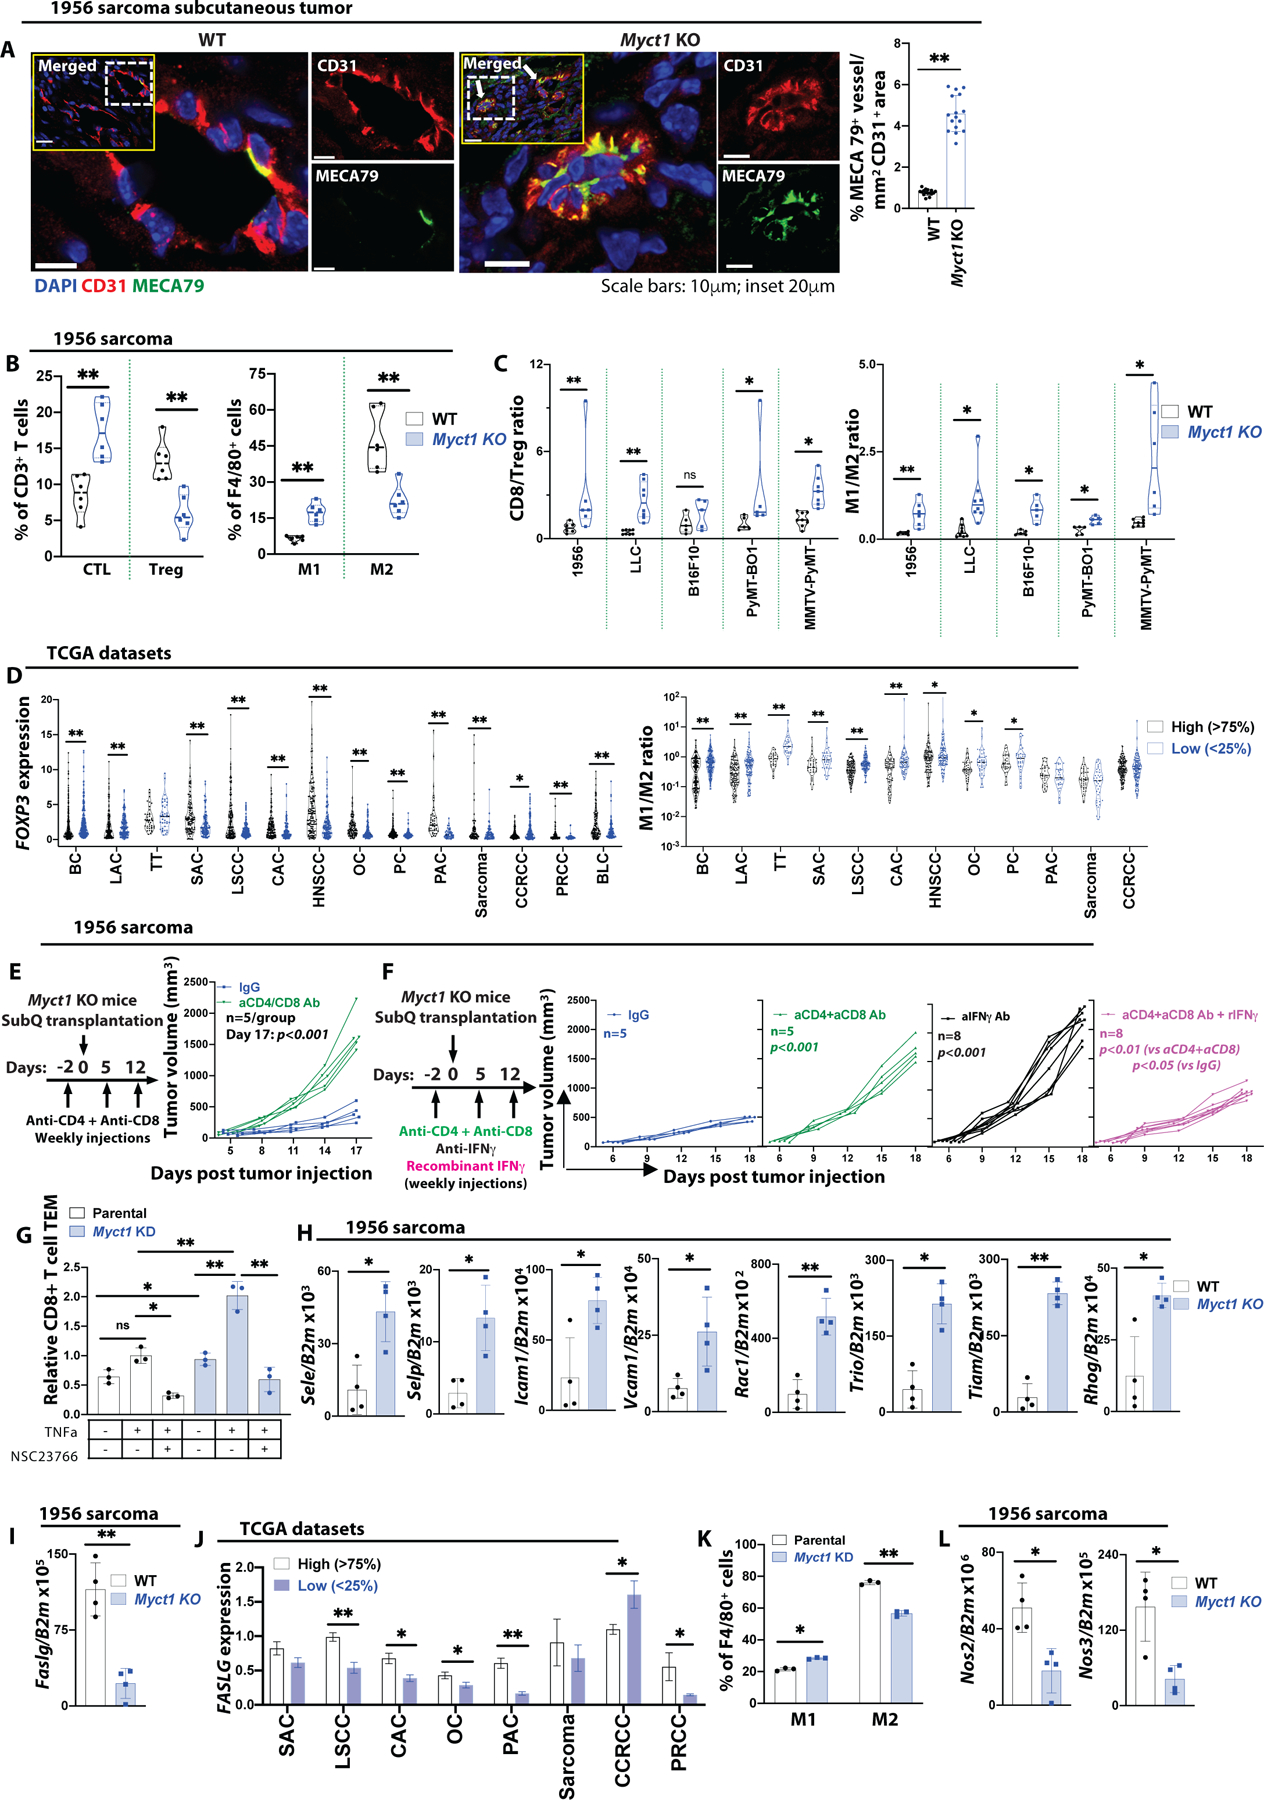
(A) Representative immunofluorescence images and quantification of MECA79+ high endothelial venules (HEVs) in 1956 sarcoma tumor. White dotted boxed area from the inset is presented as zoomed-in. Arrows in the inset indicate the MECA79 expressing vessels. Scale bars, 10μm and 20μm (inset). Data is presented as mean with SD. Statistical significance was analyzed by two-tailed Student’s t-test; **p<0.01. (B) CTL (CD8+ T cells) and Treg (CD4+FOXP3+ T cells) cells as a percentage of CD3+ T cells and M1 (iNOS+ macrophages) and M2 (CD206+ macrophage) populations as a percentage of F4/80+ cells. n=6 mice per group. Data is presented as mean with SD. Statistical significance was analyzed by two-tailed Student’s t-test; **p<0.01. (C) Analysis of CD8/Treg and M1/M2 ratios as measures of immunosuppression in the tumor microenvironment of WT and Myct1 KO mice. n=6 mice per group. Data is presented as mean with SD. Statistical significance was analyzed by two-tailed Student’s t-test; n.s.=not significant, *p<0.05, and **p<0.01. (D) (top) Analysis of FOXP3 expression in high vs. low MYCT1 expressing tumors in patients from the TCGA database. (bottom) Analysis of M1/M2 population ratios in high vs. low MYCT1 expressing tumors obtained by analyzing the TCGA patient datasets with the CIBERSORT algorithm. Datasets utilized were BC (TCGA-BRCA), LAC (TCGA-LUAD), TT (TCGA-TGCT), SAC (TCGA-STAD), LSCC (TCGA-LUSC), CAC (TCGA-COAD), HNSCC (TCGA-HNSC), OC (TCGA-OV), PC (TCGA-PRAD), PAC (TCGA-PDAC), Sarcoma (TCGA-SARC), CCRCC (TCGA-KIRC), PRCC (TCGA-KIRP), and BLC (TCGA-BLCA). Data is presented as scatter plot with the mean value. Statistical significance was analyzed by Mann-Whitney U test; *p<0.05 and **p<0.01 (E) Analysis of tumor growth in either IgG or combined anti-CD4 and anti-CD8 neutralizing antibody treated Myct1 KO mice. n=5 mice per group. Data is presented as mean with SD from one of two biological replicates. Statistical significance was analyzed by One-way ANOVA with Tukey’s multiple comparison test; p<0.001, at the end of the study. (F) Analysis of tumor growth in either IgG, or anti-IFNγ neutralizing antibody, or combined anti-CD4 and anti-CD8 neutralizing antibody, or combined anti-CD4 and anti-CD8 neutralizing antibody with IFNγ cytokine treated Myct1 KO mice. Data is presented as mean with SD. Statistical significance was analyzed by One-way ANOVA with Tukey’s multiple comparison test; ‘p-values’ indicated on the figure are calculated at the end of the study. (G) Transendothelial migration (TEM) of CD8+ T cells through parental and Myct1 KD MCEC cell barrier with TNFα and Rac1 inhibitor NSC23766 pre-treatment. Data is presented as mean with SD. Statistical significance was analyzed by One-way ANOVA with Tukey’s multiple comparison test; n.s.=not significant, *p<0.05, and **p<0.01. (H and I) Analysis of mRNA expression of the indicated genes in CD31+CD45− ECs isolated from the 1956 sarcoma tumors. n=4 mice per group. Statistical significance was analyzed by Statistical significance was analyzed by two-tailed Student’s t-test; *p<0.05 and **p<0.01. (J) FASLG expression profile in high vs. low MYCT1 expressing tumors in SAC (TCGA-STAD), LSCC (TCGA-LUSC), CAC (TCGA-COAD), OC (TCGA-OV), PC (TCGA-PRAD), PAC (TCGA-PDAC), Sarcoma (TCGA-SARC), CCRCC (TCGA-KIRC), and PRCC (TCGA-KIRP) patients from the TCGA database. Data is presented as mean with standard error of mean. Statistical significance was analyzed by two-tailed Student’s t-test; *p<0.05 and **p<0.01. (K) Polarization of peripheral blood-derived monocytes to M1 or M2 phenotype with LPS+IFNγ or IL4 cytokine treatment, respectively, in a coculture assay with either parental or Myct1 KD MCEC cells, expressed as a percentage of F4/80+ macrophage population. Data is presented as mean with SD. Statistical significance was analyzed by two-tailed Student’s t-test; *p<0.05 and **p<0.01. (L) Analysis of Nos2 and Nos3 mRNA expression in CD31+CD45− ECs isolated from the 1956 sarcoma tumor. n=4 mice per group. Data is presented as mean with SD. Statistical significance was analyzed by two-tailed Student’s t-test; **p<0.01.