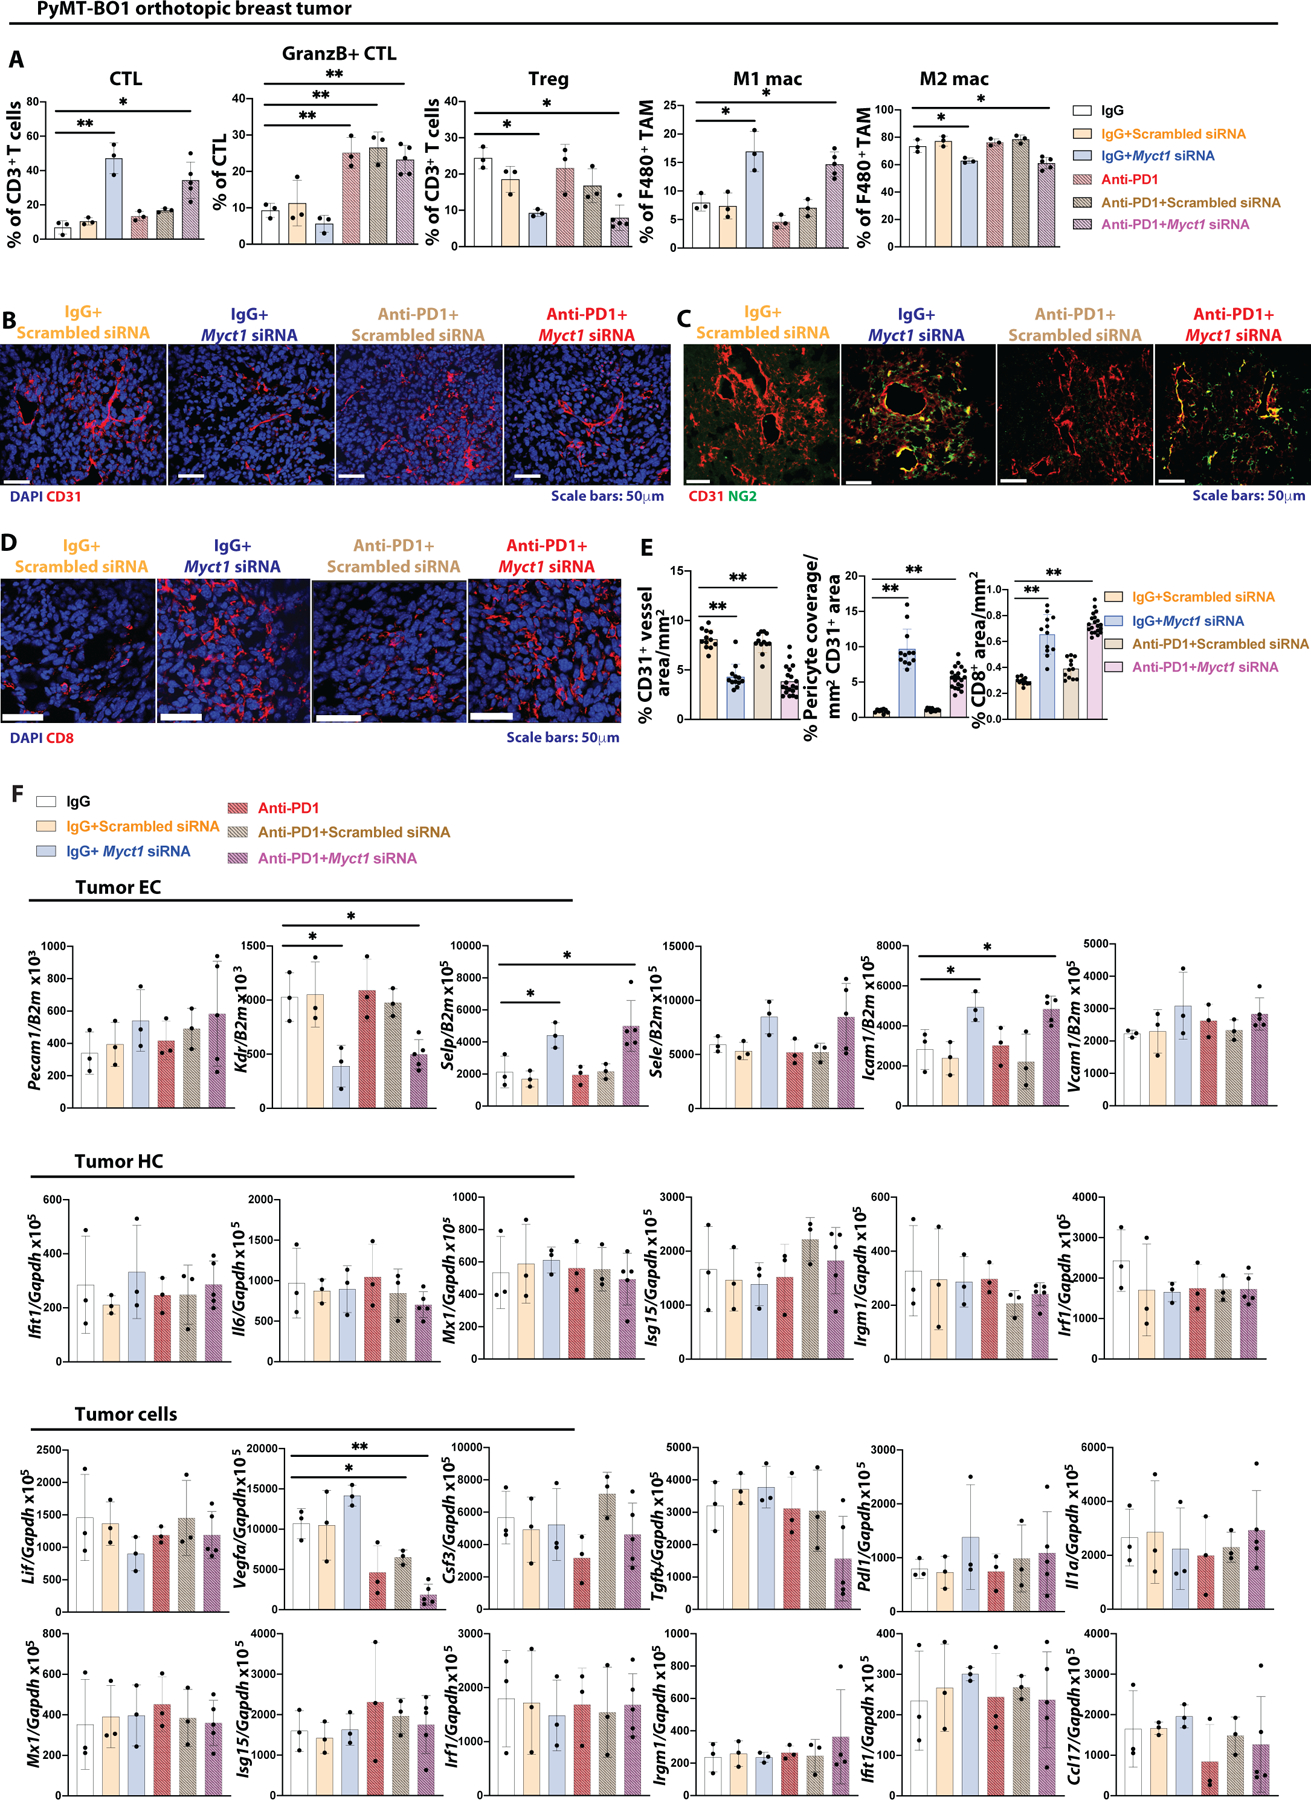
Figure 8: Anti-Myct1 works synergistically with anti-PD1 treatment to improve outcomes in mice.

(A) Analysis of CTL (CD8+ T cells) and Treg (CD4+FOXP3+ T cells) cells as a percentage of CD3+ T cells, GranzB+ CTL as % of CTL cells, M1 (iNOS+ macrophages) and M2 (CD206+ macrophage) populations as a percentage of F4/80+ cells in the tumor of the PyMT-BO1 tumor bearing WT mice with different combination of treatments as indicated. n=3–6 mice per group. Data is presented as mean with SD. Statistical significance was analyzed by One-way ANOVA with Tukey’s multiple comparison test; *p<0.05 and **p<0.01. (B-E) Representative images (B-D) and quantifications (E) for CD31+ vascular density (B), pericyte coverage (C), and CD8+ T cell infiltration in the tumor mass of PyMT-BO1 tumor bearing WT mice with different combination of treatments as indicated. n=3–6 mice per group. Data is presented as mean with SD. Statistical significance was analyzed by One-way ANOVA with Tukey’s multiple comparison test; **p<0.01. (F) Analysis of the expression of the indicated genes in the tumor ECs, hematopoietic cells (HC), and tumor cells sorted from the PyMT-BO1 tumor bearing WT mice with different combination of treatments as indicated. n=3–6/group. Data is presented as mean with SD. Statistical significance was analyzed by One-way ANOVA with Tukey’s multiple comparison test; *p<0.05 and **p<0.01.
