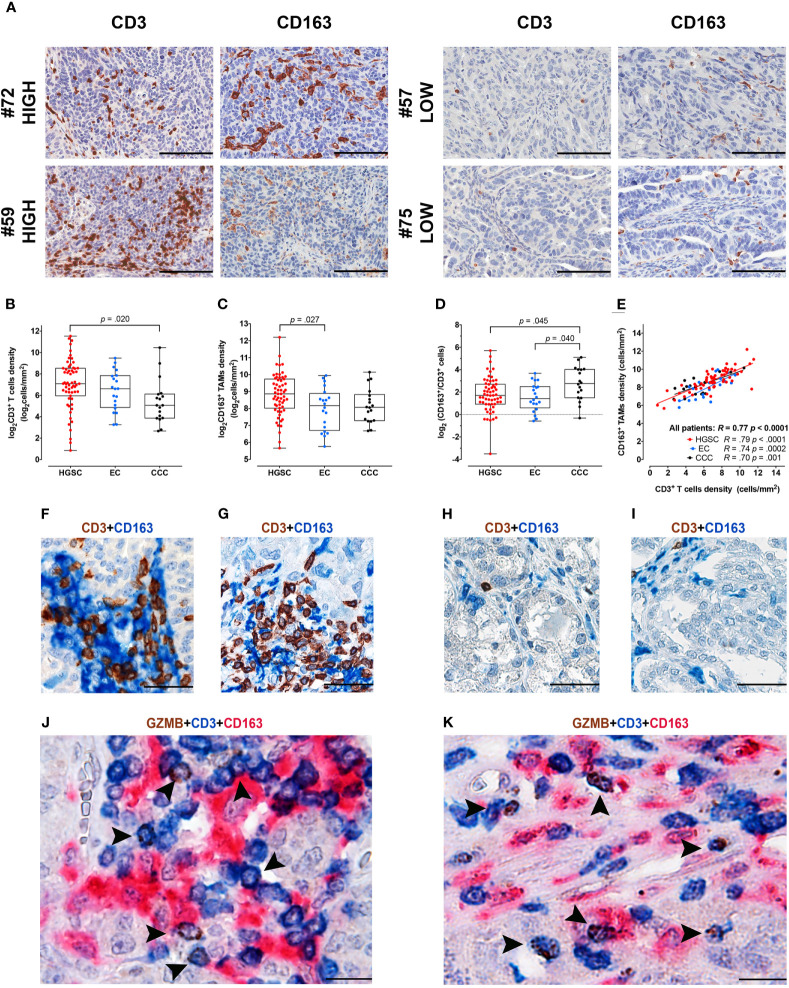
Figure 1.
Immune contexture in OCs by digital microscopy and interactions of CD3+ T-cells and CD163+ TAMs. (A) Sections are from four representative HGSCs (case #72, #59, #57 and #75) and immunostained for CD3 and CD163, recognizing T-cells (left column) and tumor-associated macrophages (TAMs) (right column). Case #72 and #59 are HGSCs with rich immune cell density, characterized by high CD3+ T-cells and CD163+ TAMs, intraepithelial and stromal infiltrates. In opposition case #57 and #75 correspond to two HGSCs with low immune cell density, showing very low-number of CD3+ T-cells and CD163+ TAMs. Sections are counterstained with hematoxylin. Images had been acquired form Digitalized slides using Aperio Image Scope (Leica Biosystems) Magnification 200×; scale bar 100 um. Box plots showing CD3+ T-cells (B) and CD163+ TAMs (C) densities in different OCs subtypes. Box-plots showing the ratio of CD163+/CD3+ densities (D). Scatter plot (E) illustrating the correlation analysis between CD163+ and CD3+ immune cells’ densities in the whole cohort and among different OCs subtypes. P values estimated by One-way ANOVA with Tukey’s correction for multiple comparisons in (B–D); R and P values estimated by Pearson correlation test in (E). Sections from HGSCs (F, G, J, K) and CCCs (H, I) cases and immunostained as labeled, showing common interactions between T-cells and CD163+ TAMs observed in HGSCs and not in CCCs; magnification: 400× (F–I), 600× (J, K); scale bar: 50 um (F–I); 33 um (J, K). HGSC, High Grade Serous Carcinoma; EC, Endometrioid Carcinoma; CCC, Clear Cell Carcinoma.

