Figure 7.
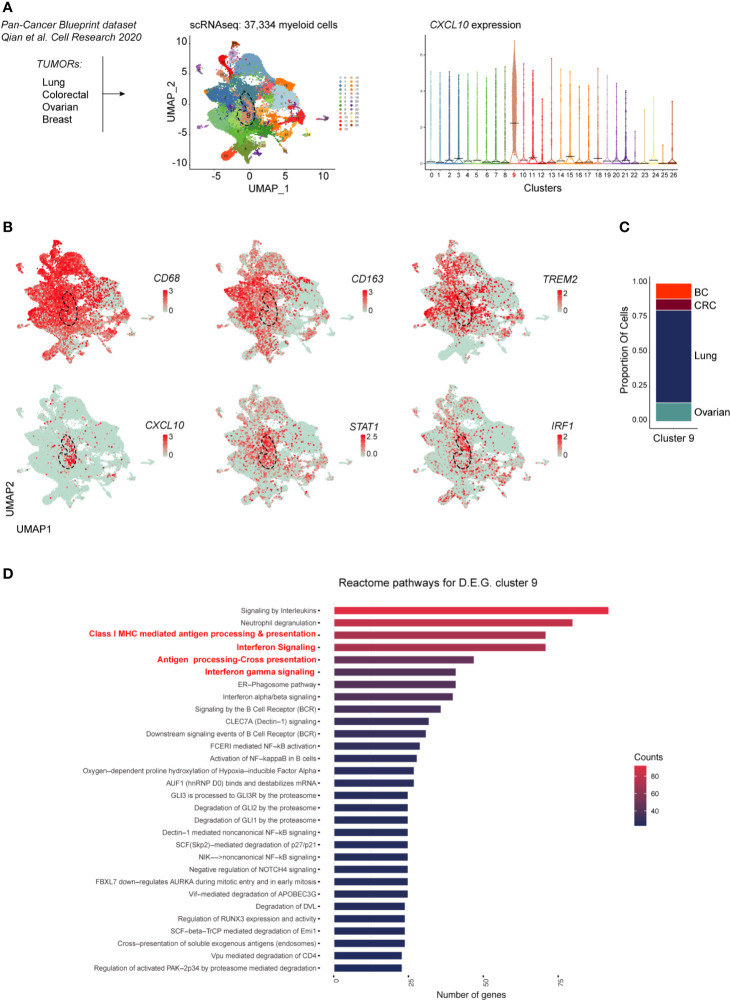
scRNAseq analysis of myeloid cells across cancer types. In (A) is shown the experimental design from published dataset: scRNAseq of myeloid cells (left panel). Dimensionality reduction of scRNAseq data merged from lung, colorectal, ovarian and breast tumors was performed using a Louvain graph-based clustering identifying 27 clusters (middle panel). Each dot represents an individual cell (n = 37,334). Violin plots illustrating expression distributions among the 27 clusters of CXCL10 (right panel). UMAP plot showing expression of CD68, CD163, TREM2, CXCL10, STAT1 and IRF1 (B). Proportion of cells of the CXCL10+ cluster 9 per tumor type (C); BC, breast cancer; CRC, colorectal cancer. Reactome pathway analysis for genes characterizing cluster 9 (adjusted P value <0.05) (D).

