
Fig. 4.
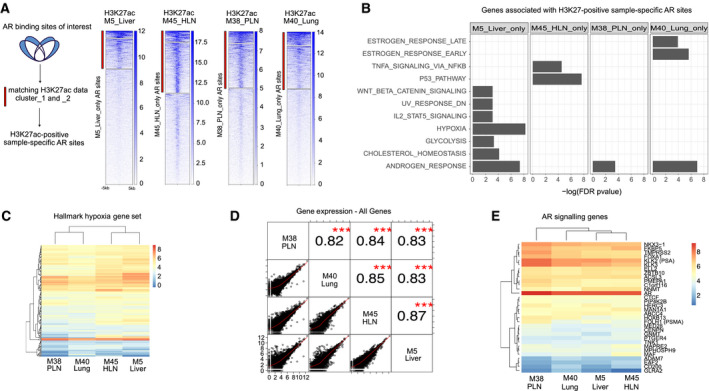
Cistromic differences have minimal impact on transcriptional output in anatomically distinct metastatic sites. (A) Left, Schematic of subset analysis approach. Sample enriched AR sites (blue) were subsetted for matching H3K27ac signal (k‐means cluster 1 and 2, red bar). Right: For each sample, sample‐specific AR sites were examined for raw H3K27ac signal (red bar indicates sites used to associate with nearest gene). (B) Barchart of −log10(FDR) enrichment for Hallmarks Gene Sets (MSigDB) in sample‐specific gene sets. Missing bar indicates the gene set was not among the top 12 significantly enriched sets in that sample. (C) Heatmap of gene expression for Hallmark Hypoxia Gene Set genes. Normalized gene expression shown from low (blue) to high (red). (D) Correlation matrix of normalized log‐transformed gene expression data for all samples for all genes. Pearson correlation and significance are indicated in the top right (*** indicates P < 0.0001). (E) Heatmap of normalized gene expression for of AR signaling genes (27) (top) and AR, FOXA1, and HOXB13 genes (bottom). Normalized gene expression shown from low (blue) to high (red).