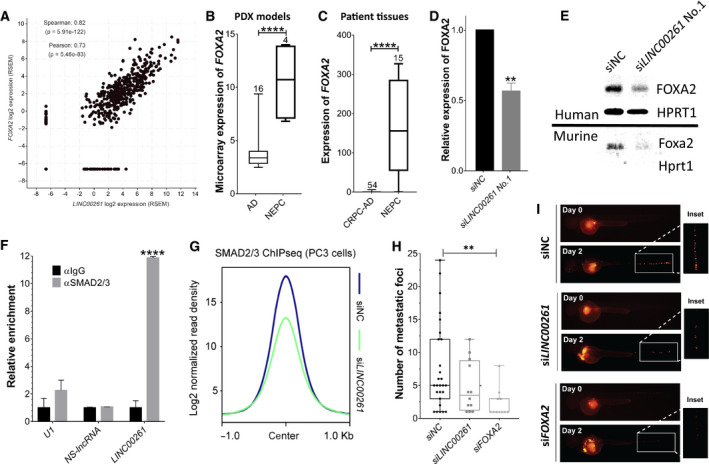
Fig. 4.

Nuclear LINC00261 promotes transcription of FOXA2 to drive invasion in NEPC cells. (A) Correlation between FOXA2 and LINC00261 expression in transcriptomic data (RNA‐seq) from prostate adenocarcinoma patients (TANRIC database; Spearman's correlation = 0.82). (B) Relative expression (microarray) of FOXA2 in several PDX models of prostate adenocarcinoma (n = 16) and NEPC (n = 4) from the Living Tumor Laboratory (**P = 0.0050). (C) Relative expression (qPCR) of FOXA2 in FFPE biopsy samples from t NEPC (n = 34) and CRPC‐AD (n = 15) patients (Beltran et al. [16]; ****P < 0.0001). (D) FOXA2 expression (qPCR) in PC‐3 cells transfected with a nontargeting control (siControl) or siRNA targeting LINC00261 (**P = 0.0016). (E, top panel) Immunoblots showing FOXA2 protein expression in PC‐3 cells transfected with a nontargeting control (siControl) or siRNA targeting LINC00261 (HPRT1 serves as loading control). (E, bottom panel) Expression of murine Foxa2 protein in NEPC OPT7714 cells transfected with a nontargeting control (siControl) or siRNA targeting 9030622O22‐Rik. (F) Relative quantification (qPCR) of U1, NS‐lncRNA, and LINC00216 transcripts in RIP experiments using anti‐IgG or anti‐SMAD2/3 antibody in PC‐3 cells. (G) SMAD2/3 ChIP‐seq peak profile plot averaged from 6724 binding sites in PC‐3 cells treated with either the nontargeting control siRNA (siNC) or siRNA targeting the LINC00261 (siLINC00261) gene. (H) The number of distinct metastatic foci in the body of zebrafish embryos injected with PC‐3‐RFP cells with or without LINC00261 or FOXA2 knockdown (P = 0.0146). (I) Representative images of zebrafish embryos from panel H. (B, C) Data Analyzed by two‐tailed unpaired t‐test. (B) Data obtained from the living tumor laboratory. (C) RNA‐seq data were obtained from the public database cBioPortal using the Trento NEPC dataset. (D) Analyzed by two‐tailed t‐test. (F) Analyzed by one‐way ANOVA with the Siddak post hoc test. (H) Analyzed by two‐way ANOVA with Dunnett's post hoc test. All data are shown as mean ± SEM and are from at least three biological replicates.
