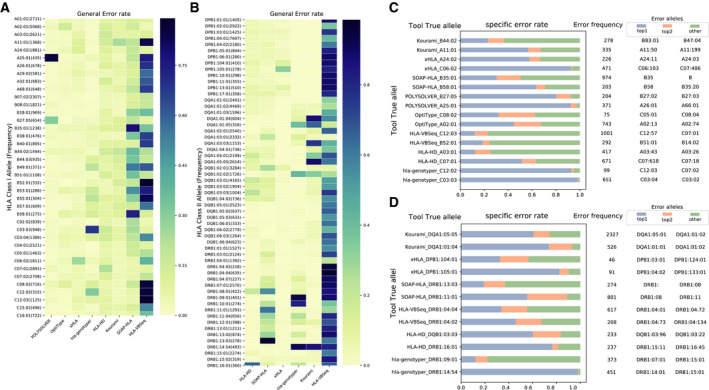
Fig. 3.

Overview of errors in each tool. (A). Heat map of HLA Class I alleles’ error rate across eight tools. (B). Heat map of HLA Class II alleles’ error rate across six tools. The alleles were picked out according to two criterions: 1). The frequency of the alleles in benchmark dataset ≥200. 2). The general error rate is no less than 0.05 in at least one of the tools. (C). The specific error rate of HLA Class I alleles in eight tools. Each row means a specific error rate pattern made by a tool. The blue bar indicates the percentage of highest specific error alleles. The orange bar means the percentage of top 2 high error alleles. The green bar represents the percentage of the other alleles. For example, in the first row started with “Kourami_B44:02”, the allelic counts of B44:02 mis‐assigned as other alleles by Kourami is 278. Specifically, 64 of them were reported as B83:01 in blue bar (specific error rate 23.02%). 38 of them were identified as B47:04 in orange bar (specific error rate: 13.67%). 176 of them were incorrectly assigned as other alleles in green bar. (D). The specific error rate of HLA Class II alleles in six tools.
