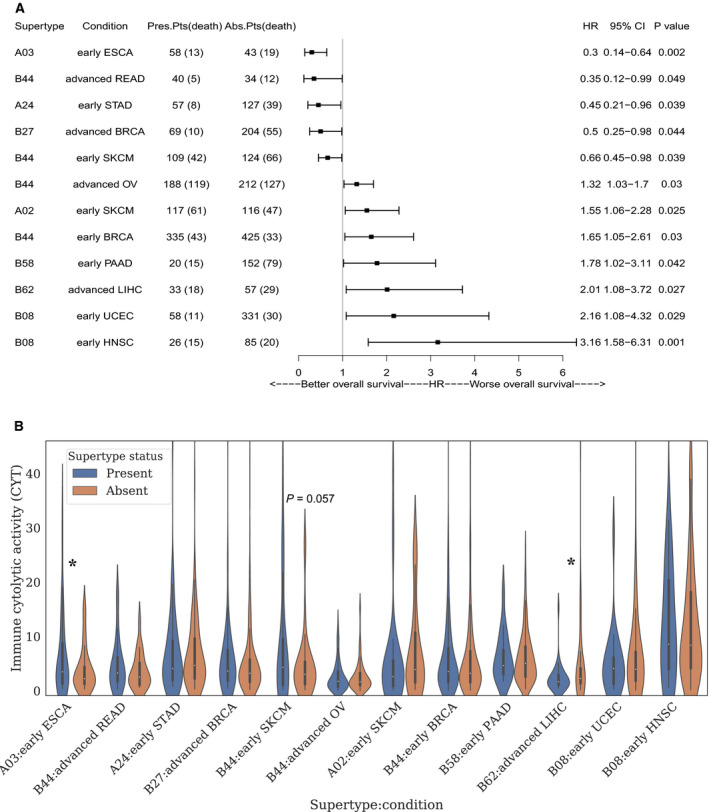
Fig. 5.

The survival impact of HLA alleles in TCGA cancer conditions. (A) Forest plot of univariate CoxPH analyses on OS. According to the supertypes status, either ‘present’ or ‘absent’ were assigned to each patient. Only the supertypes with significant influence on OS were displayed. (B) Immune cytolytic activity analysis on HLA supertypes under specific cancer conditions mentioned in Fig. 4A. The patients with specific HLA supertype were marked in blue. While, orange bar represents the supertype‐absent patients. Violin plot and one‐tailed t test were generated by python package seaborn and statsmodels, respectively. “*” indicate significant with t test P value ≤ 0.05.
