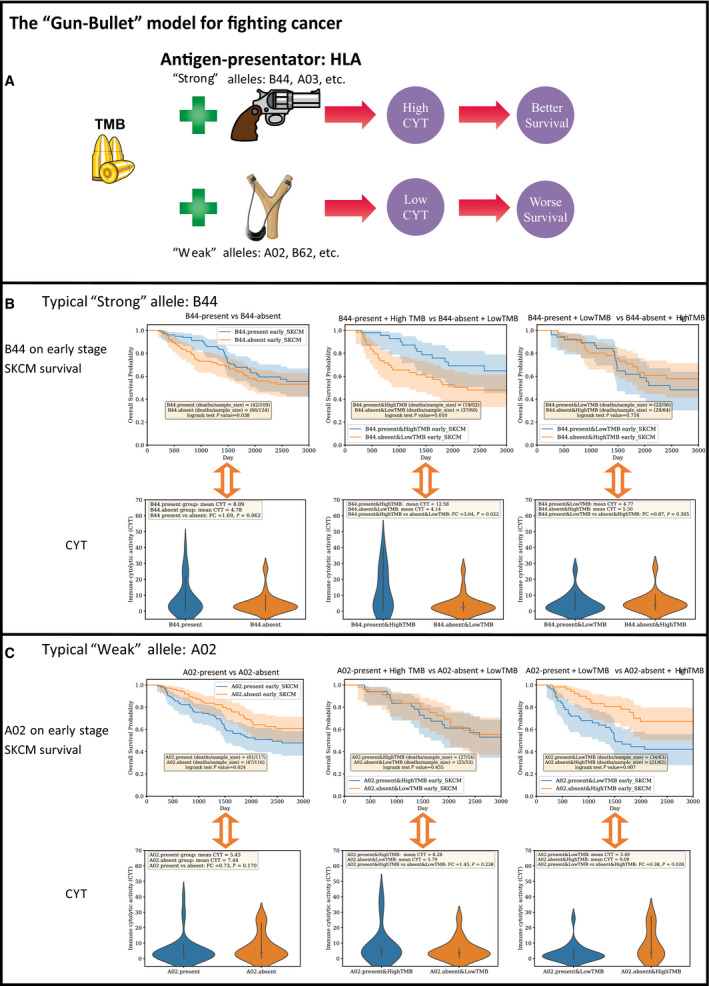
Fig. 6.

The “Gun‐Bullet” model for illustrating the survival impact of HLA. (A). The brief chart illustrates how TMB and HLA exert the impact of survival through CYT. The impact of HLA alleles on OS may partially due to CYT. A strong HLA plus a high TMB could stimulate intensive immune response (CYT), leading to a better survival. Stronger HLA alleles are more able to present antigens (TMB) and subsequently induce higher CYT. The relationship between TMB and HLA allele is quite similar to the bullet and gun. A powerful gun plus high quantity bullets could maximize the force. The clipart in the figure were downloaded from http://clipart‐library.com with the licence of copyright free for non‐commercial use. (B). The typical ‘strong’ HLA B44 in early stage SKCM survival. Kaplan‐Meier survival analysis and corresponding CYT comparison were implemented for the following three cohort pairs: B44‐present vs B44‐absent; B44‐present&HighTMB vs B44‐absent&LowTMB; B44‐present&LowTMB vs B44‐absent&HighTMB. (C). The typical ‘weak’ HLA A02 in early stage SKCM survival. Survival analysis and corresponding CYT comparison were implemented for the following three cohort pairs: A02‐present vs A02‐absent; A02‐present&HighTMB vs A02‐absent&LowTMB; A02‐present&LowTMB vs A02‐absent&HighTMB. Survival curves and violin plot were generated by python package lifelines and seaborn, respectively. One‐tailed t test was implemented by R. High and Low TMB groups were determined by whether the TMB values higher or lower than the median TMB of the specific cancer condition. For example, the sample size of patients in early stage SKCM TCGA cohort is 237. The median TMB in early stage SKCM is 9.521. (see the full median TMB information in Table S10).
