Figure 3.

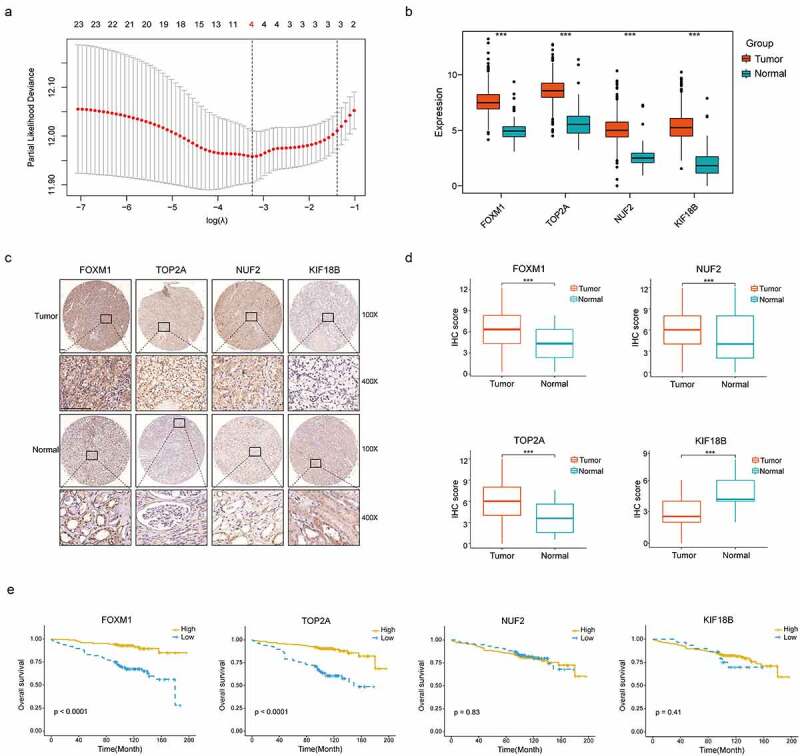
Construction of the gene signature. (a) 10-time cross validation for tuning parameter selection by LASSO regression. The solid vertical lines are partial likelihood deviance ± standard error (SE). The dotted vertical lines are drawn at the optimal values by minimum criteria and 1-SE criteria (b) Expression levels of 4 selected genes between tumors and peritumor tissues in TCGA database (c) Representative immunostaining pictures of 4 selected genes. Staining of FOXM1, TOP2A and KIF18B are mainly located in the nuclei as well as cytoplasm, staining of NUF2 are mainly located in the cytoplasm. The upper half comprises images of tumors, images of adjacent normal tissues were at the bottom half. Scale bar: 100 μm. (d) Expression levels of 4 selected genes between tumors and peritumor tissues in the TMA cohort. (e) Kaplan–Meier survival analysis of 4 selected genes in the TMA cohort. ***P < .001
LASSO, Least Absolute Shrinkage and Selection Operator regression; TCGA, The Cancer Genome Atlas; TMA, tissue microarray.
