
Figure 4.
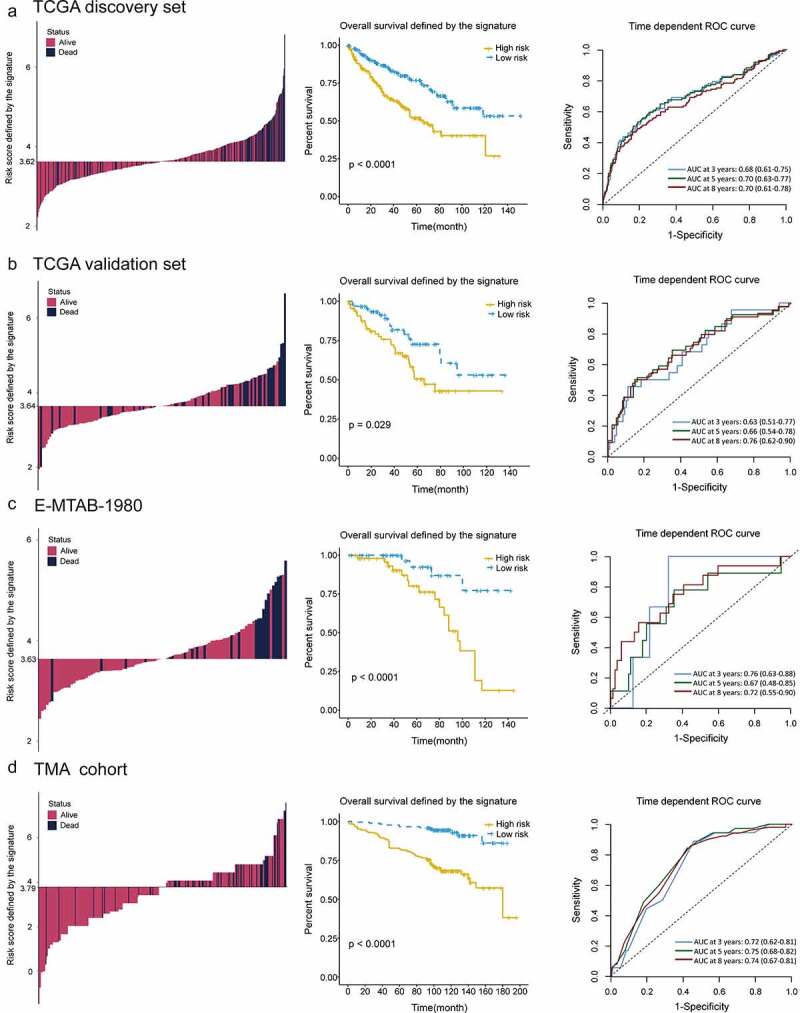
Distribution of risk score, Kaplan–Meier survival analysis, time-dependent ROC curves at 3, 5, and 8 years between patients at high- and low-risk in TCGA discovery set (a), TCGA validation set (b), E-MTAB-1980 (c) and TMA cohort (d)
ROC, receiver operating characteristic; TCGA, The Cancer Genome Atlas; TMA, tissue microarray.