Figure 5.

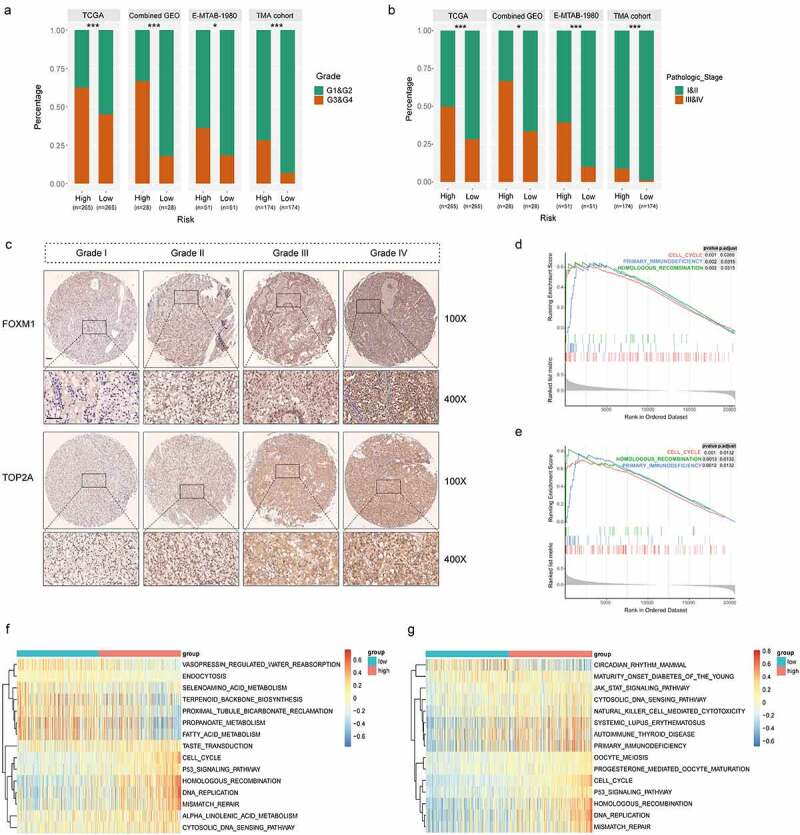
High correlations of the gene signature with tumor grade and pathologic stage followed by functional analysis of signature genes. (a) Distribution of G1&G2 and G3&G4 tumors between high- and low-risk group in TCGA, combined GEO (GSE66272 & GSE36895), E-MTAB-1980 and TMA cohort. (b) Distribution of stage I/II and III/IV tumors between high- and low-risk group in TCGA, combined GEO (GSE66272 & GSE36895), E-MTAB-1980 and TMA cohort. (c) Representative immunostaining pictures of FOXM1 and TOP2A between different tumor grade. Scale bar: 100 μm. Top 3 gene sets enriched in the high-expression group of signature genes (d) FOXM1 (e) TOP2A. Clustering heatmaps of differentially enriched pathways for signature genes based on GSVA. (f) FOXM1 (g) TOP2A. χ2 test was used to test difference in distribution of tumor grade and pathologic stage, *P < .05.**P < .01.***P < .001
GEO, Gene Expression Omnibus; GSVA, gene set variation analysis; TCGA, The Cancer Genome Atlas; TMA, tissue microarray.
