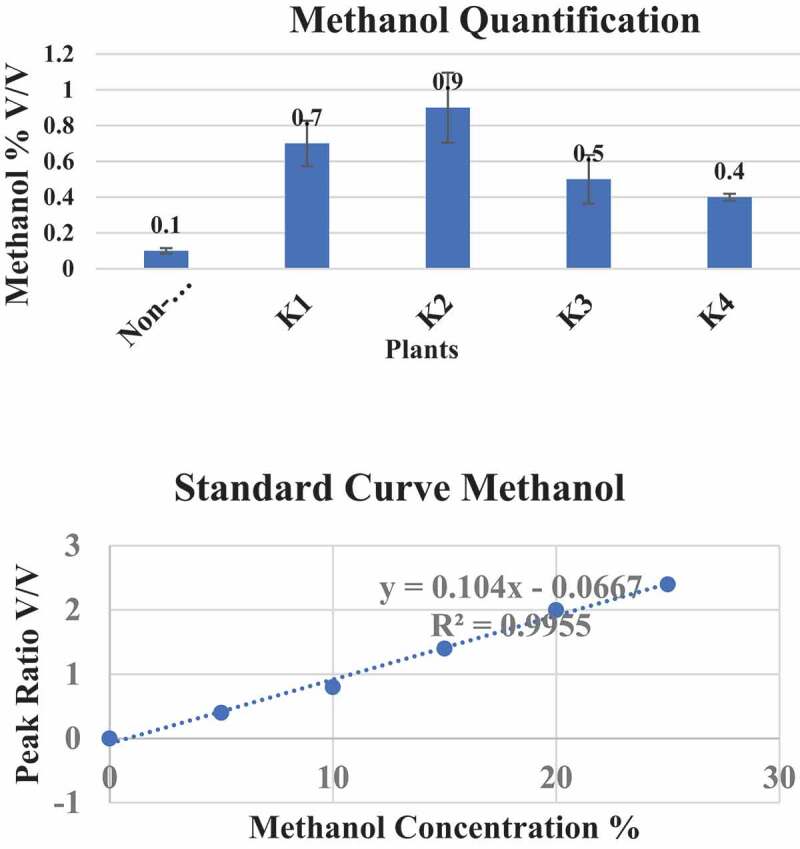
Figure 6.

Methanol quantification in transgenic cotton plants. Standard curve of methanol was done by Mass Spectrometry (MS) with reference to a methanol standard. The transgenic cotton plants, namely, K1, K2, K3, K4 were subjected to methanol quantification
