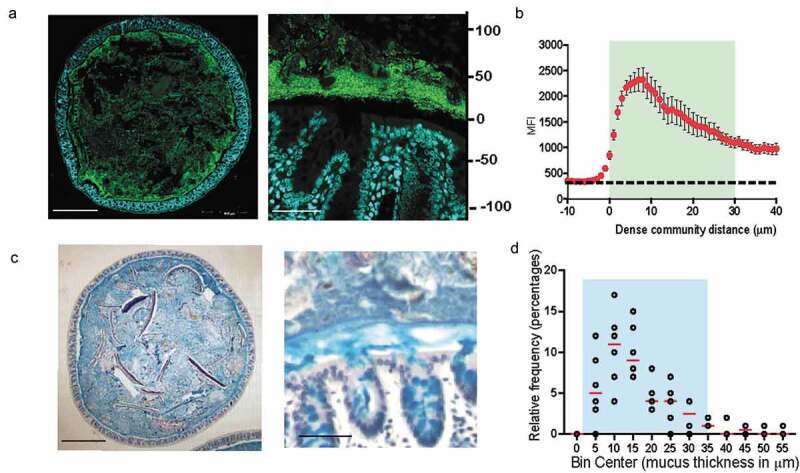
Figure 1.

Dense band of bacteria forms overlying colonic mucosa
A. Colonic cross-section stained with fluorescent probes identifying all bacteria (green) and host epithelium (blue) to show dense community structure close to the host (Left: 10x; Right: 60x).B. Mean fluorescence intensity (MFI) measurements from a representative mouse (average N = 3, SEM) to show bacterial concentration of the dense community. Measurements start 10-μm before start of bacterial signal closest to epithelial lining.C. Colonic cross-section stained with Alcian Blue/Pas to show dense mucus layer (Left: 10x; Right: 60x).D. Relative frequency of dense mucus layer thickness measurements, described in Methods section under “Mucus Thickness” (N = 6 mice, 40 measurements each).
