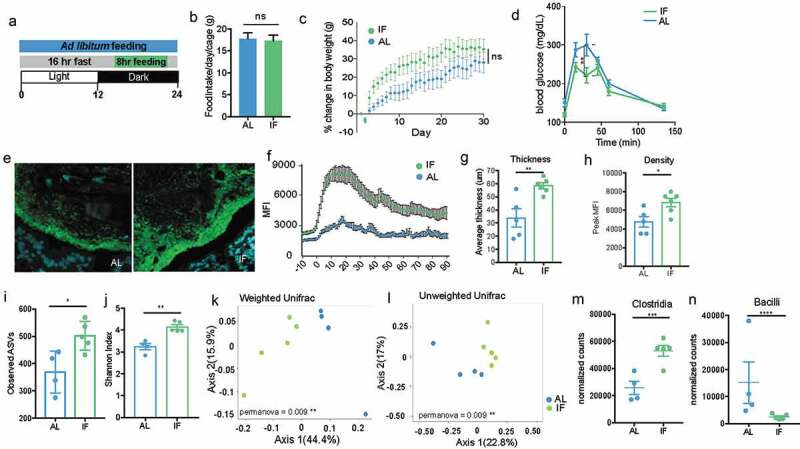
Figure 7.

Intermittent fasting increases thickness and density of biofilm-like community and significantly alters community composition
A. Experimental design for intermittent fasting experiment. Intermittent fasting (IF) mice were allowed ad libitum feeding during an 8-hour feeding window during the dark cycle and fasted for the remaining 16 hours. This was repeated every day for 30 days. A control group was given continuous ad libitum (AL) feeding. B. The number of grams of food eaten per 24-hour period by each cage showing no significant difference in the amount consumed between AL and IF mice (SD).C. Percent change in body weight over the course of the experiment showing no significant difference in the increase in body weight between AL and IF mice (SD).D. Blood glucose levels taken before, 15 min, 30 min, 45 min, 60 min, and 130 min post glucose injection showing a significant increase in blood glucose levels of AL mice at 30 min post-injection, suggesting reduced insulin sensitivity compared to IF mice (N = 6 mice per group, SEM). *p < .05, **p < .01 2-way ANOVA. E. Colonic cross-section stained with fluorescent probes identifying all bacteria (green) and host epithelium (blue) of dense community structure with Left: Ad libitum feeding and Right: Intermittent fasting, showing increase in thickness and density with IF treatment. F. Overlay of MFI measurements from representative IF and AL mice showing difference in thickness and density (SEM).G. Thickness of dense community structure after AL and IF measured by MFI showing significantly thicker communities after IF (N = 5–6 mice per group, SD). *p < .05 unpaired t-test.H. Peak MFI measurements of dense community structure after AL and IF showing significantly denser communities after IF (N = 5–6 mice per group, SD). *p < .05 unpaired t-test.I. Observed ASVs found in AL and IF LCM-captured communities (150-μm) showing significantly higher richness in IF communities. Samples were rarefied to lowest sampling depth for normalization (N = 4–5 mice per group, SD). *p < .05 unpaired t-test.J. Shannon diversity in AL and IF LCM-captured communities (150-μm) showing significantly higher diversity in IF communities. Samples were rarefied to lowest sampling depth for normalization (N = 4–5 mice per group, SD). **p < .01 unpaired t-test.K. Principal coordinates of analysis (PcoA) plot using weighted UniFrac distances show LCM-captured communities (150-μm) from AL and IF are significantly different (N = 4–5 mice per group). **p < .01L. Principal coordinates of analysis (PcoA) plot using unweighted UniFrac distances show LCM-captured communities (150-μm) from AL and IF are significantly different (N = 4–5 mice per group). **p < .01M. Differential abundance of Clostridia between LCM-captured communities (150-μm) from AL and IF communities, showing significantly more Clostridia in IF communities (N = 4–5 mice per group, Log2 Fold Change = 1.04, padj = 0.0017, SD). ***p < .001 DESeq2.N. Differential abundance of Bacilli between LCM-captured communities (150-μm) from AL and IF communities, showing significantly less Bacilli in IF communities (N = 4–5 mice per group, Log2 Fold Change = 2.59, padj = 0.0004, SD). ****p < .0001 DESeq2.
